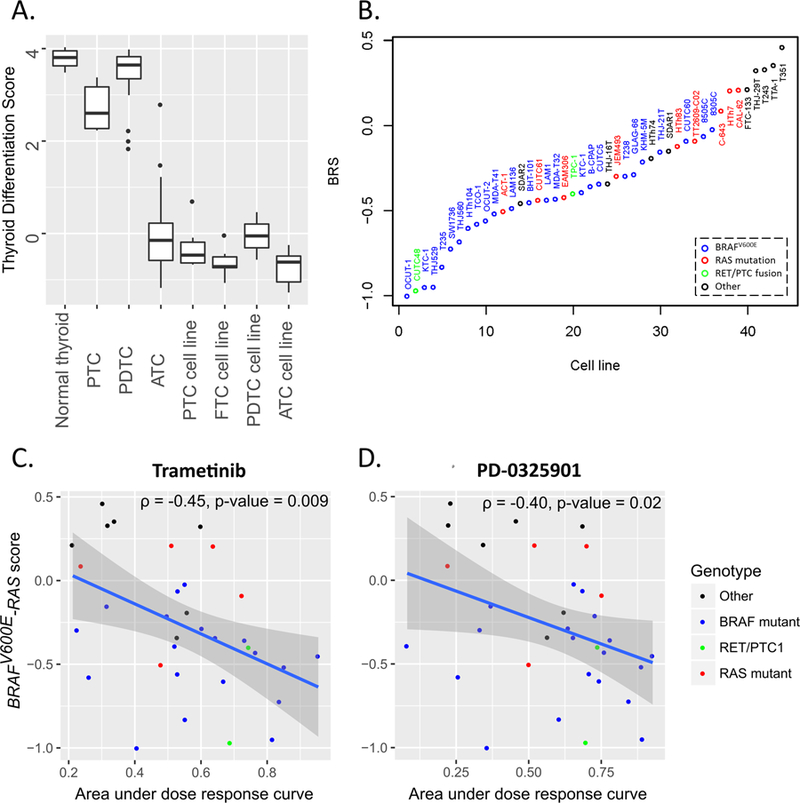
Figure 3. Thyroid differentiation score (TDS) and BRAFV600E-RAS score (BRS) in thyroid tumors and cell lines.

A. TDS of normal thyroid, thyroid cancers and thyroid cancer cell lines; B. BRS for thyroid cancer cell lines. Cell line oncogenes are labeled with different colors: blue – BRAFV600E, red – RAS, green – RET/PTC1, black – wild-type for BRAF, RAS and RET genes; C–D. Correlation of BRAFV600E-RAS score with the sensitivity to the MEK inhibitors trametinib (C) and PF-0325901 (D) in vitro. The sensitivity to MEK inhibitors is measured as area under the dose response curve (greater values indicate greater drug sensitivity). Cell line oncogenes are labeled with different colors: blue – BRAFV600E, red – RAS, green – RET/PTC1, black – wild-type for BRAF, RAS and RET genes.
