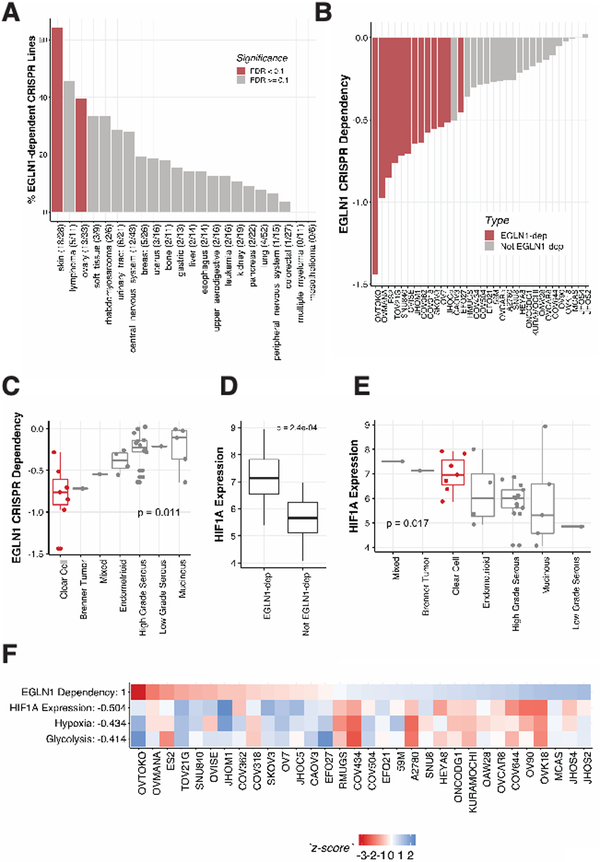
Figure 2. EGLN1 dependency is enriched in clear cell ovarian cancer and melanoma and associated with high HIF1A levels.
A. Ovarian and melanoma cancer cell lines are enriched for EGLN1 dependencies in CRISPR screens. The percentage of EGLN1-dependent lines is graphed for each lineage. Significantly enriched lineages found by lineage enrichment analysis are colored in red. Note that lung lines are also significant, but are negatively enriched for EGLN1 dependencies.
B. Distribution of EGLN1 CERES scores (Y-axis) in ovarian cancer cell lines. 13 out of 33 cell lines screened in CRISPR Cell lines have a greater than 50% probability of being dependent on EGLN1. *CAOV3 is not identified as an EGLN1-dependency, despite having a lower CERES effect score than EGLN1-dependent line EFO27, because the screen quality and other cell-line-specific differences are reflected in the CERES probabilities of dependency.
C. CRISPR EGLN1 dependencies are enriched in clear cell ovarian cancer. A two-sample t-test of clear cells vs. all other ovarian subtypes reveals that clear cells are significantly enriched for EGLN1 dependencies (p < 0.05).
D. EGLN1-dependent cell lines (n = 13) express significantly more HIF1A (Y-axis) than non-EGLN1-dependent lines (n = 20) in CRISPR. Two-sample t-test p-value < 0.01.
E. Clear cell ovarian cancer cell lines have high HIF1A expression compared to all other ovarian lines. Two-sample t-test p-value p<0.05.
F. ssGSEA (single sample Gene Set Enrichment Analysis) reveals that EGLN1 dependency is associated with HIF1A-related pathways. Pearson correlations of EGLN1 dependency with each profile (Y-axis) were calculated, and z-score normalized profiles are shown.

