
Figure 7. MALAT1 expression is not prognostic of overall survival in GBM.
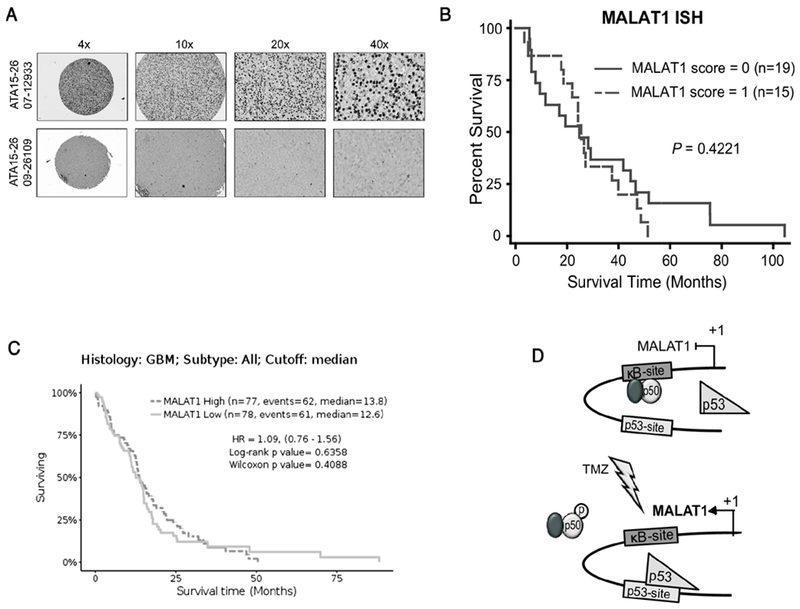
(A) Representative MALAT1 in-situ hybridization staining in GBM. Low staining (bottom) and high staining (top). (B) Kaplan-Meier survival curves in thirty-four GBM patients separated by their MALAT1 ISH staining score. Significance was analyzed by Log-rank method. (C) Kaplan-Meier survival curves in all GBM patients from TCGA based on RNA-SEQ expression separated at median value. (D) Model illustrating the mechanism by which TMZ induces MALAT1 expression. p50-containing dimers occupy the кB-site at rest (upper). Following treatment (lower), phosphorylation of p50 Ser329 leads to decreased p50 dimer binding and a concomitant increased p53 chromatin recruitment resulting in increased MALAT1 expression.