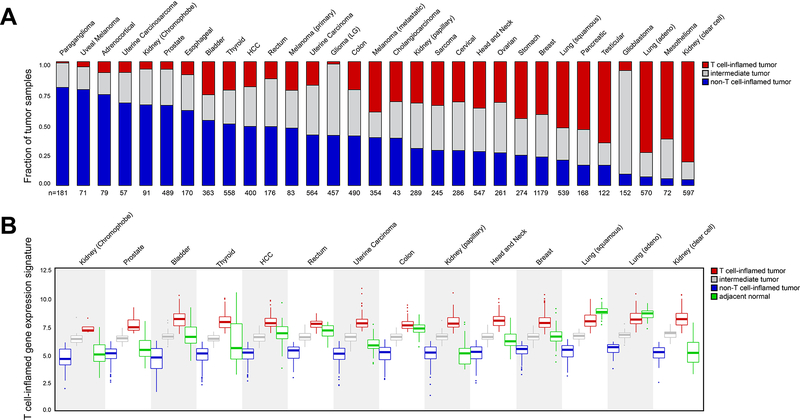
Figure 1. Landscape of T cell inflammation across 31 human solid tumors.
(A) The fraction of non-T cell-inflamed (blue), intermediate (grey) and T cell-inflamed (red) tumors in each cancer, sorted by the fraction of non-T cell-inflamed tumor high to low, with the most non-inflamed cancer on the left (Paraganglioma) and the most inflamed cancer on the right (Kidney, clear cell). The number of samples in each cancer is shown on the x-axis. (B) Distribution of T cell-inflamed gene expression in non-T cell-inflamed (blue), intermediate (grey) and T cell-inflamed (red) tumors, as well as in normal samples (green). Cancers are shown on the x-axis in the same order as in (A), and only 14 cancers with ≥ 10 normal samples are shown. The expression level of the T cell-inflamed gene expression signature (defined as, the average expression of genes from the signature in a sample) is shown on the y-axis. Each data point represents one tumor or normal sample.

