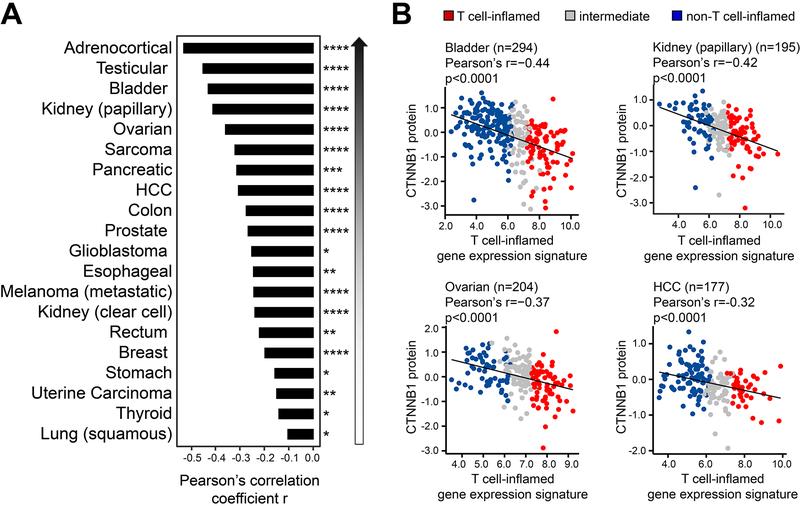
Figure 4. Inverse correlation between β-catenin protein level and T cell-inflamed gene expression.
(A) Pearson’s correlation per tumor type. 20 cancers with significant inverse correlation are shown. (B) Dot plots of β-catenin protein on Y axis and T cell-inflamed gene expression on X axis in bladder urothelial carcinoma, kidney papillary, ovarian serous cystadenocarcinoma, liver hepatocellular carcinoma (HCC) shown with linear regression correlations using Pearson’s test. The significance of such difference was computed using Pearson’s correlation, one-sided test. p < 0.05 was considered statistically significant, and significance is indicated by: * p < 0.05, ** p < 0.01, *** p < 0.001, **** p < 0.0001, after FDR-correction for multiple comparisons.

