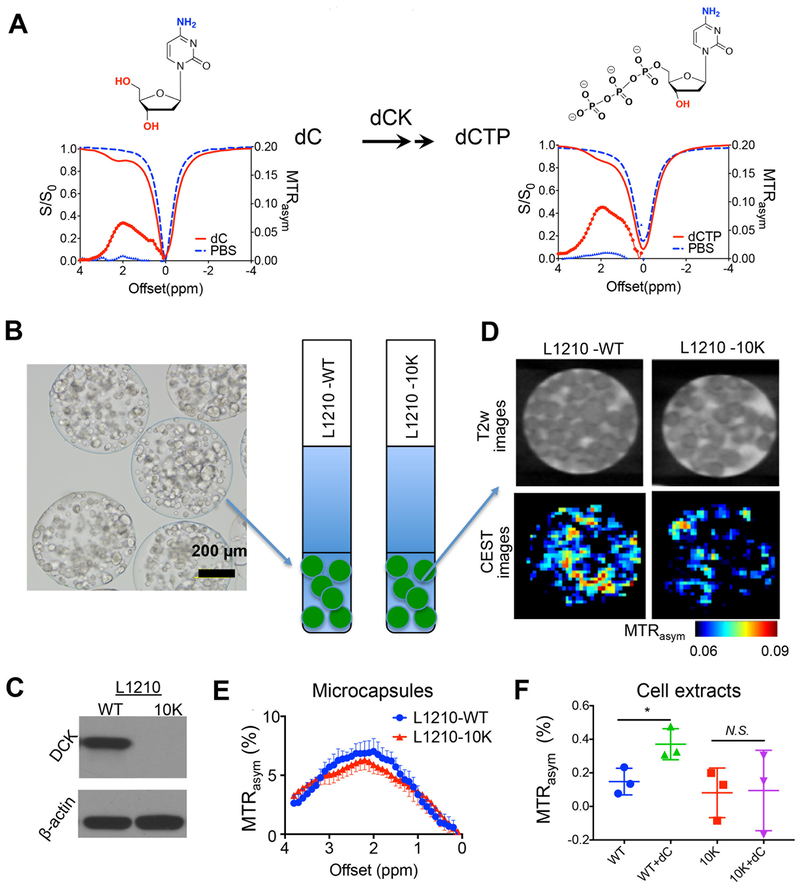
Fig. 2. In vitro CEST MRI detection of DCK activity.
(A) Chemical structures and CEST signal (Z-spectra (S/S0) and MTRasym plots) of the substrate (dC) and final product (dCTP) of dCK reaction, respectively. All solutions were 10 mM (pH 7.4 and 37 °C) in PBS. (B) A representative light microscopic image of microcapsule-encapsulated cells (left), which were imaged in PBS buffer in 5 mm NMR tubes (right). (C) Western blot confirming the different DCK expression levels in L1210-WT and L1210–10K cells. β-actin was used as loading control. (D) T2-weighted (T2w) images and corresponding CEST images of microcapsule-encapsulated DCK(+) L1210-WT and DCK(−) L1210–10K after incubating in cell culture medium containing 5 mM dC for 12 hours after washing three times using PBS. (E) Comparison of the MTRasym plots of the two types of cells in microcapsules after dC incubation. Error bars are the standard deviations of the measurements. (F) MTRasym at 2 ppm of cell extracts of 1×10⁷ L1210-WT and L1210–10K cells (diluted to 50 μL in PBS pH 7.4), with or without dC incubation for 24h. *, p<0.05, n=3.

