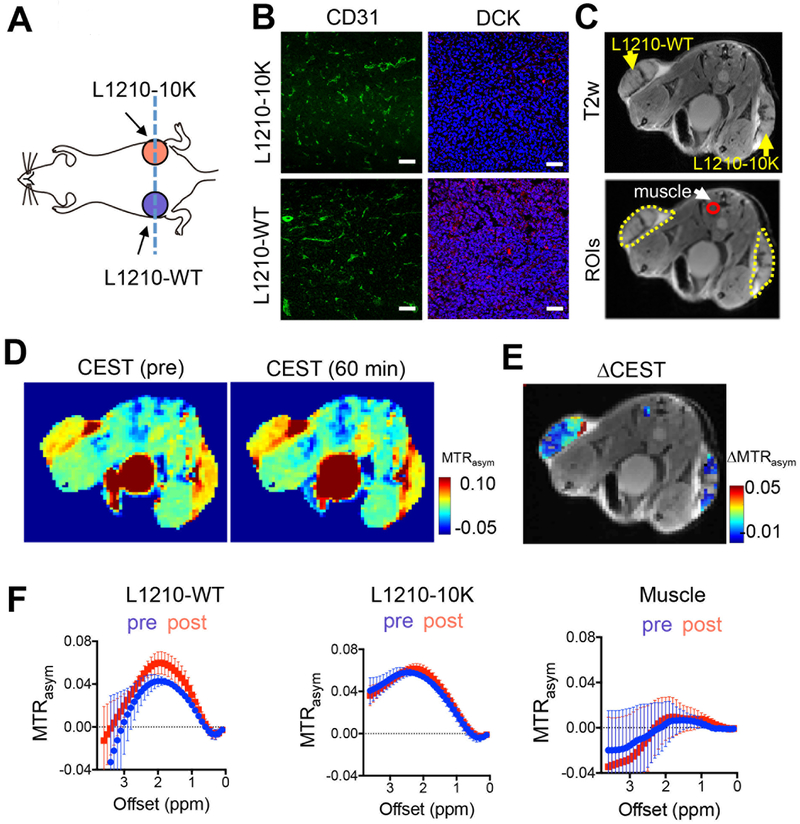
Fig. 3. In vivo CEST MRI detection of DCK activity in tumors with different DCK activity in a representative mouse.
(A) Illustration of tumor inoculation position and imaging plane (blue dashed line). (B) Fluorescence images of CD31 and DCK staining of the L1210-WT and L1210–10K tumors, respectively. Green: CD31; Red: DCK; Blue: DAPI. Scale bar: 50 μm. (C) T2w image showing the locations of DCK (+) L1210-WT (left flank) and DCK(−) L1210–10K tumors (right flank) and an image showing three ROIs encompassing the two tumors and muscle. (D) Representative MTRasym maps at 2.0 ppm before and 60 minutes after the injection. (E) Overlay image showing the CEST contrast enhancement (ΔMTRasym) in the two tumors at 60 minutes post-injection. ΔMTRasym is defined by MTRasym(t)-MTRasym(pre). (F) Mean ROI CEST signal (MTRasym plots) of pre- and 60 minutes post-injection (n=4).

