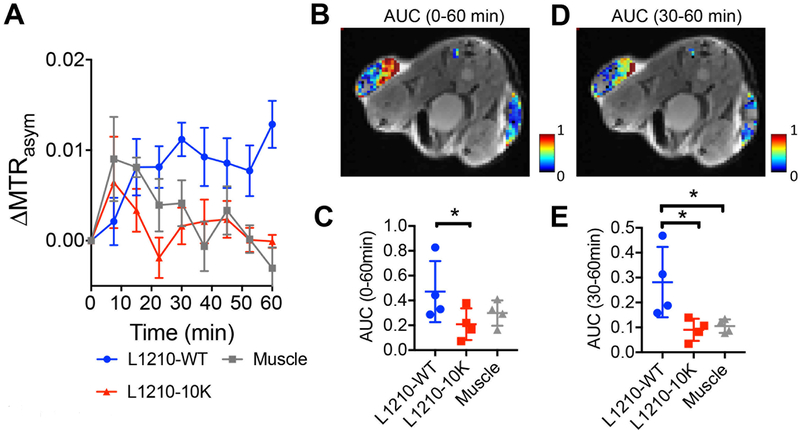
Fig. 4. Dynamic CEST MRI contrast in tumors with different DCK activity.
(A) Dynamic changes for the mean ΔMTRasym (2ppm) in the two tumors and muscle. Data are presented as mean±SEM of all the pixels within each ROI (n=4). (B) Overlay image showing the AUC (area under the curve) of the three regions over the period 0 to 60 minutes post-injection. (C) Comparison of the mean AUC (0–60 min) between DCK(+) tumors and DCK(−) tumors (n=4; two-tailed Student’s t-test, *: p<0.05). (D) Overlay image showing the AUC (area under the curve) of the three regions over the period 30 to 60 minutes post-injection. (E) Comparison of the mean AUC (30 −60 min) between DCK (+) tumors and DCK (−) tumors (n=4; two-tailed Student’s t-test, *:p<0.05).

