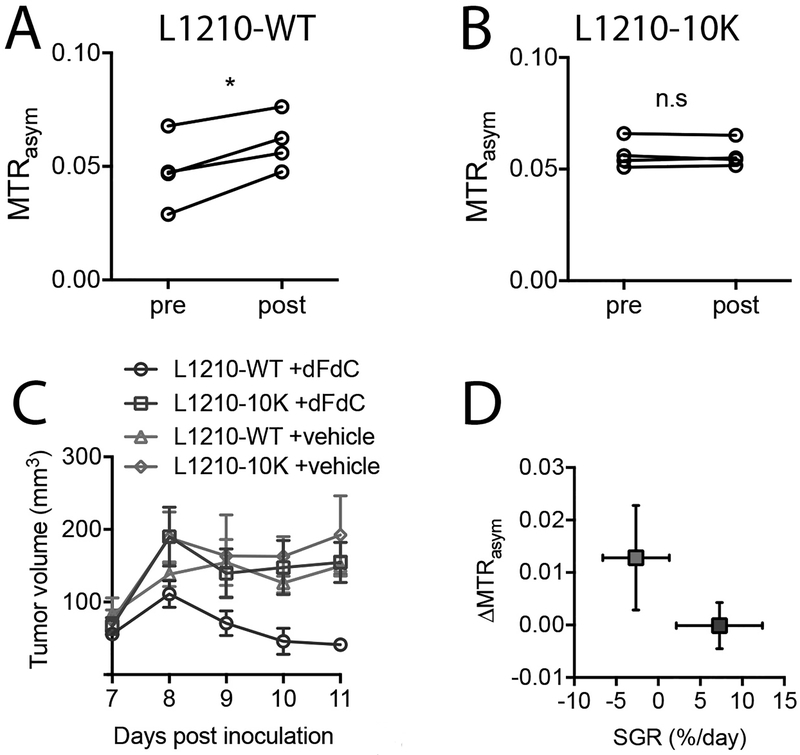
Fig.5. Using dC-enhanced CEST MRI to stratify tumors with different DCK activity and to predict tumor response to gemcitabine.
Scatter plots of MTRasym values of four L1210-WT before (pre) and at 60 min after (post) injection of dC (A) and four L1210–10K (B) tumors. *: p<0.05. n.s.: not significant (two-tailed paired Student’s t-test, n=4). (C) Treatment response to gemcitabine in L1210-WT and L1210–10K tumors as quantified by the tumor growth. Treatment (a single dose of 360 mg/kg dFdC, i.p.) was carried out at day 7 after tumor inoculation (n=5 per group). (D) Correlation between the mean CEST (ΔMTRasym) and specific growth rate ln(volumeday11/volumeday7)/5× 100% for L1210-WT and L1210–10K tumors respectively. Errors are the standard deviations of the measured ΔMTRasym (n=4) and tumor growth rate (n=5) among tumors. Red box: L1210-WT; blue box: L1210–10K.

