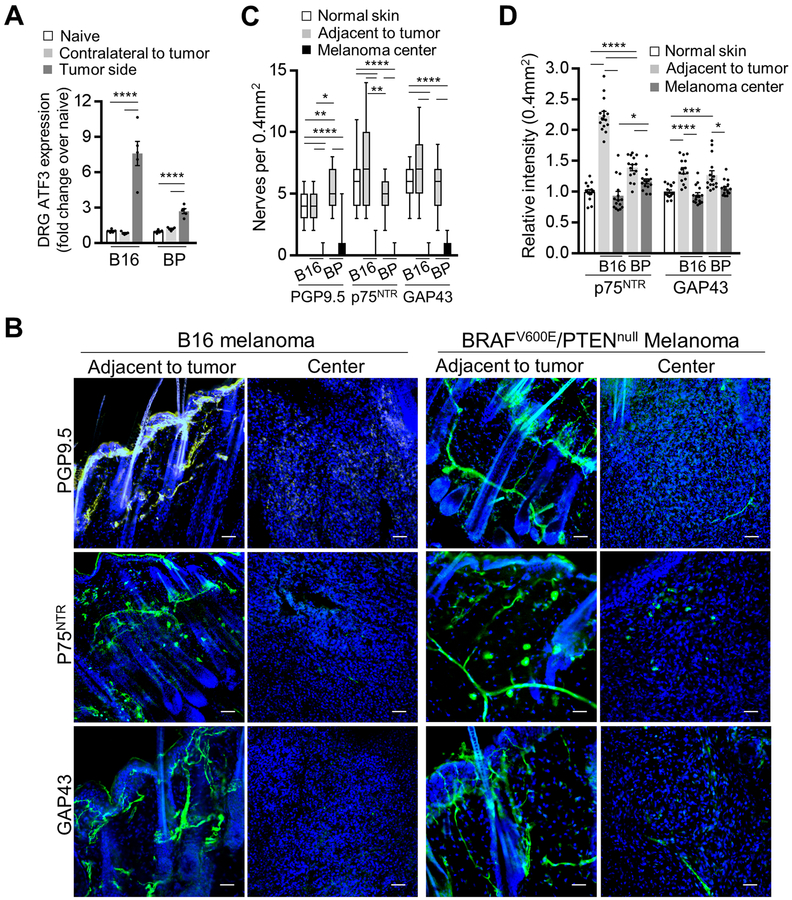
Figure 4. Mouse melanoma tumor models induce nerve injury phenotype in the adjacent nerves and Schwann cells.
(A) Transcript levels of ATF3 from DRG (combined T10-L2 per mouse) which supplied mouse dermatomes bearing either injected B16 cells (analyzed 2 weeks after injection) or induced BP melanoma (analyzed 2 weeks after induction). DRG from non-tumor bearing mice (labelled as naive) and those contralateral to the tumor served as controls. Transcript levels were determined by qRT-PCR and were normalized to those from non-tumor bearing mice; n = 5. (B) Representative immunofluorescence images of the nerves (green: PGP9.5 – nerve fiber, p75NTR– SC, GAP43 – nerves/SC; blue: DAPI) in the tissue adjacent to or in the center of either implanted B16 or induced BP melanoma. Scale bars: 50 μm. (C) Enumeration of nerve projections detected in 0.4 mm2 of normal mouse skin, in the center of the implanted B16 or induced BP melanoma or in the tissue adjacent to melanoma using immunostaining for nerve fiber and SC markers PGP9.5, GAP43, p75NTR. Center line, median; box limits, upper and lower quartiles; whiskers, max and min. (D) Relative fluorescence intensities of p75NTR and GAP43-immunostained normal mouse skin, implanted B16 and induced BP melanomas. Intensities (average over 0.4 mm2 visual field) were normalized to normal skin average. Data are means ± SEM; n = 3 independent samples with five different 0.4 mm2 images per sample. One-way ANOVA with Tukey’s multiple comparisons test (A, C, D). *P<0.05, **P<0.01, ***P<0.001, ****P<0.0001.

