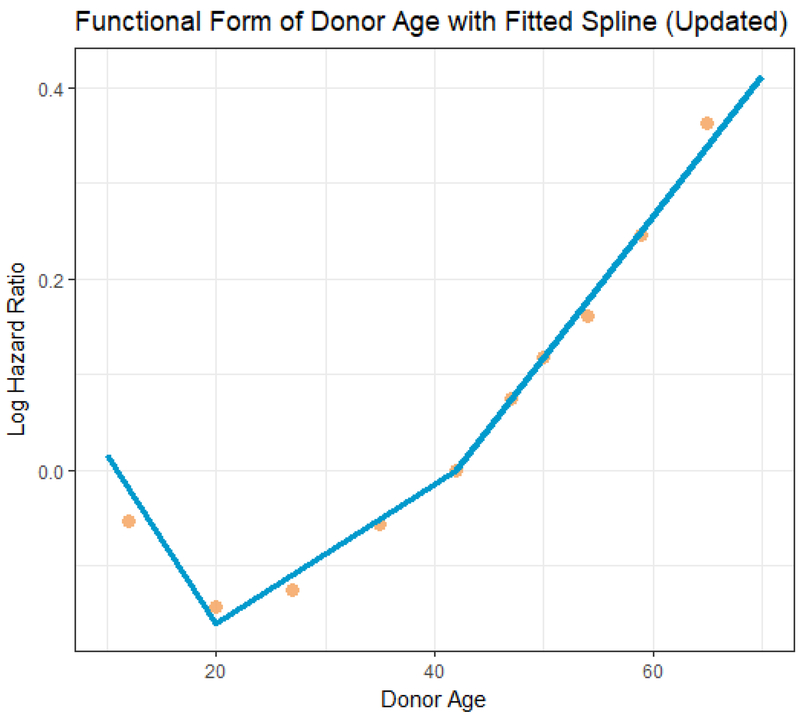
Figure 3.
Updated model: Relationship between donor age and graft failure risk. The dots represent the covariate-adjusted log hazard ratio (HR) from a model with donor age categorized into deciles. Each log HR is plotted against its respective category median. The line is the linear spline used in the updated KDRI model.

