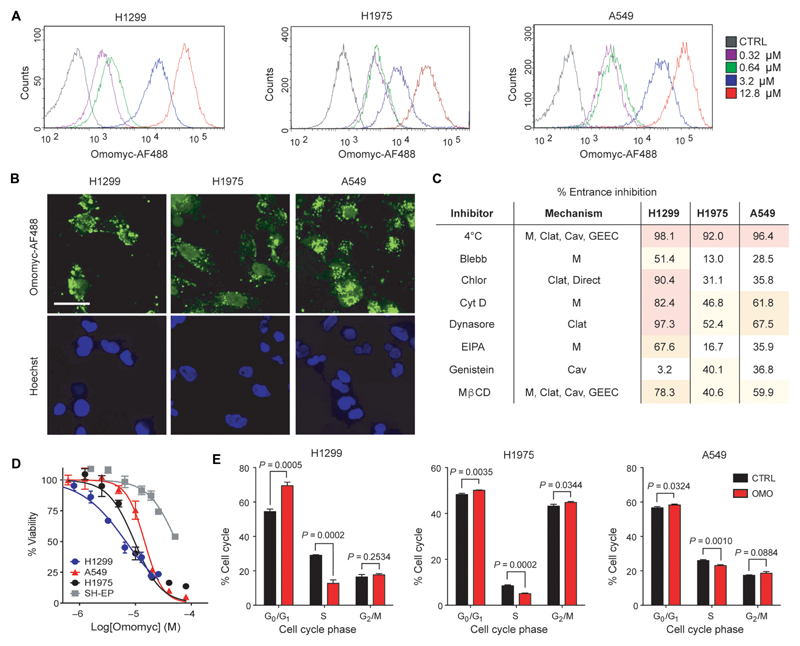
Fig. 2. The Omomyc mini-protein spontaneously penetrates into human NSCLC cells.
(A) Lung adenocarcinoma H1299, H1975, and A549 cell lines were treated with 0.32, 0.64, 3.2, or 12.8 μM Omomyc-AF488 for 15 min in serum-free medium, trypsinized, and analyzed by flow cytometry. (B) H1299, H1975, and A549 cells were treated with 3.2 μM Omomyc-AF488 for 4 hours, stained with Hoechst 3342, washed, mounted, and analyzed by confocal microscopy. Scale bar, 10 μm. (C) NSCLC cell lines were preincubated at 4° or 37°C and treated with 0.64 μM Omomyc-AF488 for 15 min at the same temperature, trypsinized, and immediately analyzed by flow cytometry or pretreated with inhibitors (Blebb, blebbistatin; Chlor, chlorpromazine; Cyt D, cytochalasin D; EIPA, 5-ethylisopropylamiloride; Mβ methyl-β-cyclodextrin) of endocytosis or lipid raft-mediated macropinocytosis (M, macropinocytosis; Cav, caveolin-mediated; Clat, clathrin-mediated) and then treated with 0.64 μM Omomyc-AF488 for 15 min in the presence of the inhibitor followed by trypsinization and analysis by flow cytometry. Inhibition of entrance (%) compared to vehicle-treated cells at 37°C is shown for each cell line. (D) Dose response of the NSCLC panel of cells and of MYC-independent SH-EP cells to increasing concentrations of Omomyc as measured by resazurin dye colorimetric assay. The median inhibitory concentration (IC50) was 5.9 μM for H1299, 8.2 μM for H1975, 11.4 μM for A549, and 25.6 μM for SH-EP cells. (E) Quantification of cell cycle phase populations from flow cytometric analysis of PI incorporation after 3 days of treatment with 12.8 μM Omomyc (OMO) compared to vehicle control (CTRL). All experiments were performed at least twice for each condition. Mean and SD are shown in (D) and (E), and statistical significance was calculated by a two-tailed unpaired Student’s t test.

