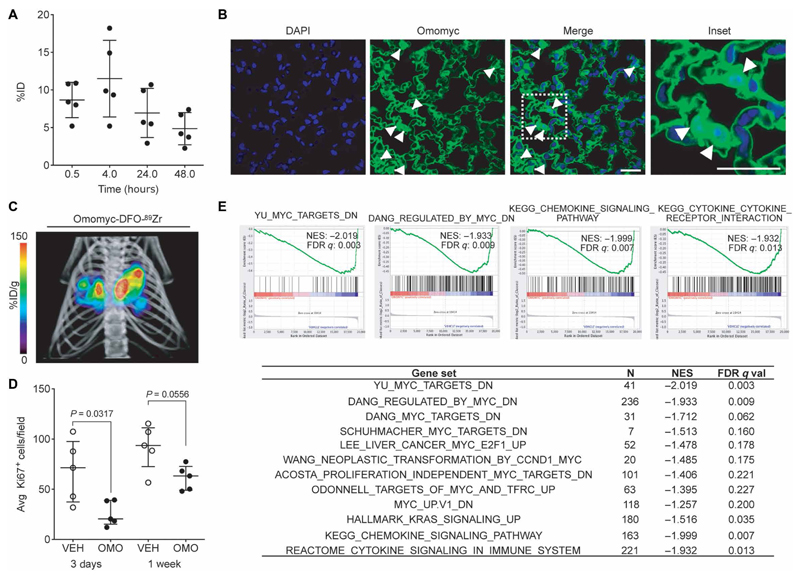
Fig. 4. Omomyc displays efficacy in a lung adenocarcinoma mouse model upon intranasal administration.
(A) Quantification of Omomyc-DFO-89Zr detected in the lungs of healthy mice as a function of time is represented as %ID. Mean, SD, and number of animals are shown. (B) Immunofluorescence of lung tissue from mice treated with the Omomyc mini-protein. A specific anti-Omomyc antibody confirms the presence of Omomyc in the lung cells 4 hours after administration. Arrowheads indicate positively stained nuclei. Scale bars, 10 μm. Higher magnification of the area surrounded by a white dashed line is shown in the right panel. (C) 3D rendering of mPET/mCT imaging of lungs of a tumor-bearing mouse 24 hours after intranasal administration of Omomyc-DFO-89Zr (2.37 mg/kg). CT data are displayed in gray scale and Omomyc-DFO-89Zr mPET data in color scale (n = 2 mice were analyzed). The color scale is expressed as %ID/g for Omomyc-DFO-89Zr uptake. See the accompanying supplementary movie for a rotating representation (Movie S1). (D) Graphical representation of total cells scored as proliferating (Ki67-positive) cells in the lung of mice treated for 3 days or 1 week with Omomyc (2.37 mg/kg) or vehicle (VEH). Median, interquartile range (IQR), and number of animals are shown. Two-tailed unpaired Mann-Whitney test was used to analyze statistical differences between the groups. (E) GSEA comparing gene expression in lung tumors from vehicle-treated versus Omomyc-treated mice. NES and false discovery rate (FDR) q values of MYC signatures and other relevant gene sets are shown. Four representative plots are shown.

