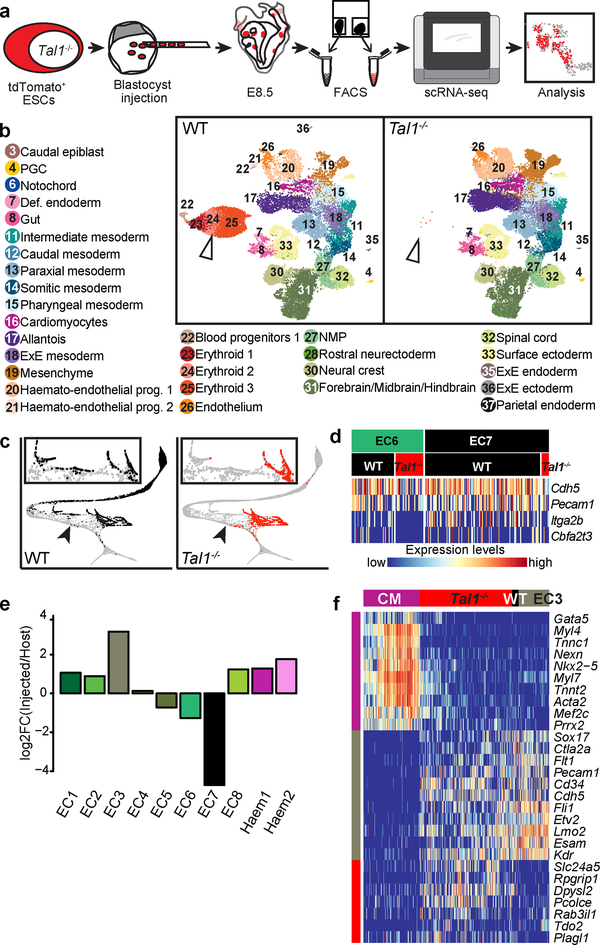
Figure 4: Mapping Tal1−/− chimeras to the atlas identifies molecular states associated with defects in haemato-endothelial development.
a, Experimental design for Tal1−/− chimera generation and sequencing. b, UMAPs of chimera cells (25,078 WT cells; 26,326 Tal1−/− cells). Points are coloured and numbered according to their computationally assigned cell type, as in Figure 1. Numbers and legend have only been specified for those cell types that are clearly visible in the plot. White arrowhead highlights blood cells, which are depleted in mutant cells. c, Mapping of blood-related cells from the chimera onto the blood-related cells from the atlas. Left: WT (9,336 cells); right: Tal1−/− (2,911 cells). Arrowheads denote the position at which blood development appears blocked in Tal1−/− cells. d, Heatmap illustrating the row-normalised expression of blood (Cbfa2t3 and Itga2b) and endothelial (Cdh5 and Pecam1) genes in EC6 WT (43 cells), EC6 Tal1−/− (28 cells), EC7 WT (117 cells), and EC7 Tal1−/− (7 cells) cells. e, Log-fold-change abundance of Tal1−/− cells with respect to WT chimera cells in each of the clusters. Below are the absolute numbers of cells resulting from the injected Tal1−/− cells (red) and from the host WT (black). f, Heatmap illustrating the row-normalised expression of genes upregulated in EC3-mapped Tal1−/− cells. From left to right, columns represent a sample of atlas cardiomyocytes (CM) (200 cells), Tal1−/− EC3 (328 cells), (3) WT EC3 (23 cells) and (4) atlas EC3 cells (107 cells). Illustrative genes have been manually selected from the full heatmap shown in Extended Data Fig. 8a.

