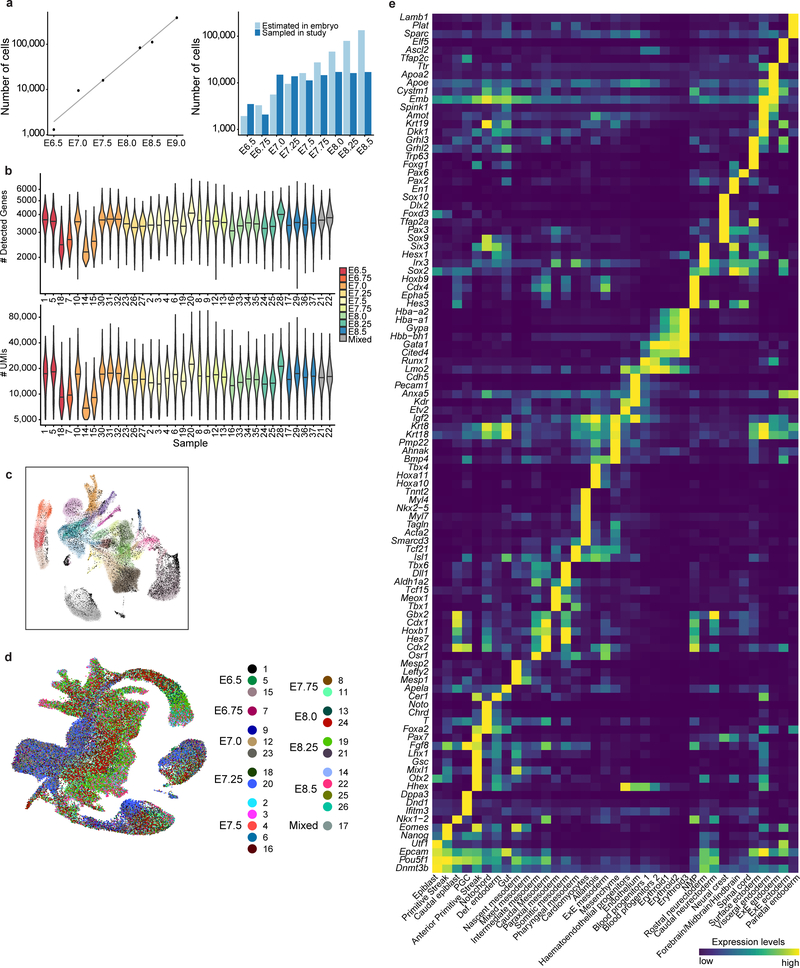
Extended Data Figure 2: Data quality control.
a, Left: Estimated number of cells present in a single mouse embryo at each time-point. Points are values measured in24; line is an Ordinary Least Squares regression fit. Right: Number of cells captured in this study compared to the number of cells estimated in the embryo in (Left). b, Violin plots illustrating the number of detected genes (top) and Unique Molecular Identifiers (UMIs, bottom) per cell per sample. Sample 11 failed quality control and is therefore not shown. Sample details are provided in Supplementary Information Table 1. c, UMAP highlighting additional cells identified considering a reduced UMI threshold of 1,000. Additional cells are shown in black. Cells from the atlas are shown in the colour corresponding to their cell type (Fig. 1c). Note that all additional cells are present alongside cells from the atlas: no new cell types are found. d, UMAP as shown in Fig. 1c with cells coloured by biological replicate, showing consistency between samples collected at the same time-point. e, Mean gene expression of diagnostic markers (y-axis) for each cell type (x-axis) are shown. Genes are row-normalised.

