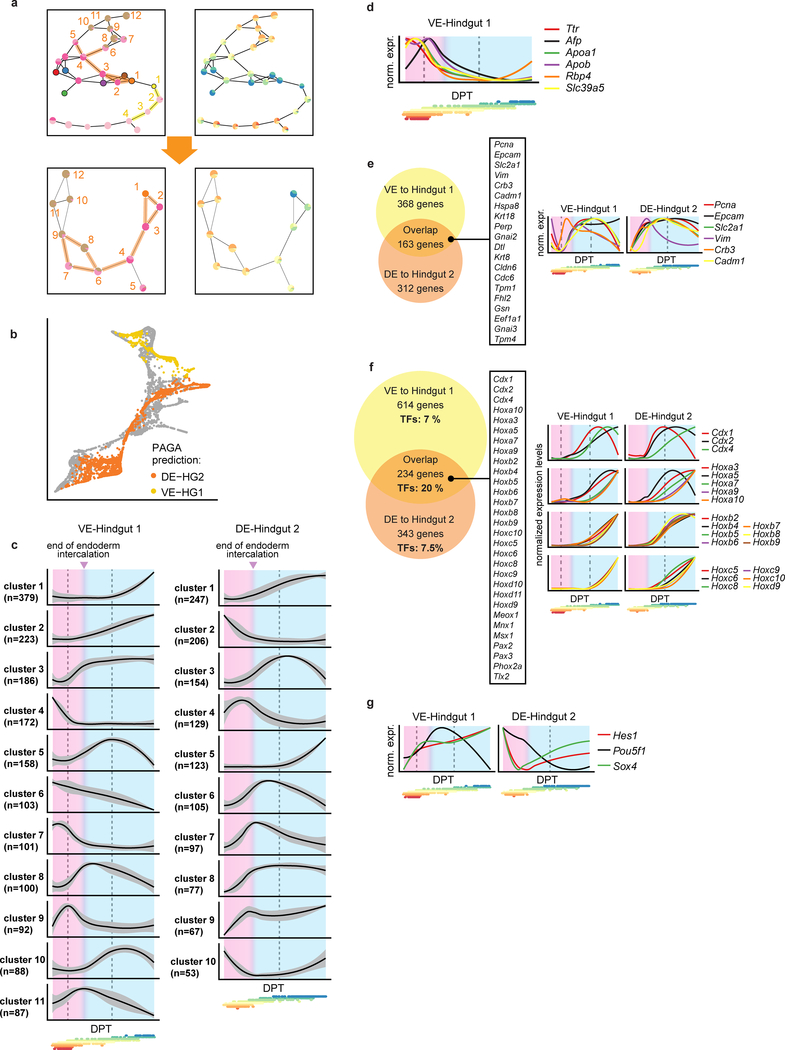
Extended Data Figure 5: Endoderm trajectories.
a, Top: Graph abstraction of the endoderm landscape after fine sub-clustering as an alternative method to resolve which cells should be part of the VE-Hindgut 1 trajectory or the DE-Hindgut 2 trajectory (supporting transport maps; see Methods). Edges along VE-Hindgut 1 trajectory highlighted in yellow (nodes 1–4; yellow numbers. Edges along DE-Hindgut 2 trajectory highlighted in orange (nodes 1–12; orange numbers). Bottom: Graph abstraction with the subset of nodes related to the DE-Hindgut 2 trajectory to resolve the origin of cluster 4 (between 5 and 6 in top panel). Resulting DE-Hindgut2 trajectory includes clusters 1–4 and 6–9. The right hand panel overlays information about the composition of each cluster by developmental stage. b, Force-directed graph coloured by graph abstraction (PAGA) trajectories. Note that this independent approach for trajectory identification reaches very similar results to those inferred by transport maps in Fig. 2h. c, Gene-normalised dynamics of all clusters found along the VE-Hindgut 1 and the DE-Hindgut 2 trajectory (x-axis: DPT along the trajectory, y-axis: normalized expression levels). The black line is the mean fitted expression level across all genes in each cluster. Grey shading indicates the standard deviation along the trend across all genes in the cluster. Pink area highlights intercalation process; blue area highlights gut maturation steps. Dashed lines correspond to additional stages in the process deduced from the changes in gene expression trends. Points below the plots are the DPT coordinates of cells from each time-point coloured according to time-point as in Fig. 1f (from E6.5 in red to E8.5 in blue). d, Gene-normalised dynamics of VE genes along VE-Hindgut 1 trajectory indicating VE maturation prior to the intercalation stage. Plot design is as in (c); d-g: Below the x-axis, points are as in (c). e, Left: Venn diagram of genes up-regulated during the intercalation process in both VE-Hindgut 1 (in clusters 3, 5, 8, 11) and DE-Hindgut 2 (in clusters 4, 6, 7, 8, 9) trajectories. Listed genes: signature of epithelial remodelling in the overlapping fraction. Right: expression trends of illustrative genes along the trajectories (gene-normalised). f, Left: Venn diagram of genes up-regulated after the intercalation process in both trajectories (VE-Hindgut 1: clusters 1, 2, 5, 10; DE-Hindgut 2: clusters 1, 3, 5, 10); the overlapping fraction was enriched in transcription factors including a large subset of homeodomain proteins (listed). Right: gene-normalised dynamics of Hox and Cdx genes along the trajectories. g, Gene-normalised dynamics of transcription factors up-regulated specifically in the VE-Hingut 1 trajectory during endoderm intercalation.

