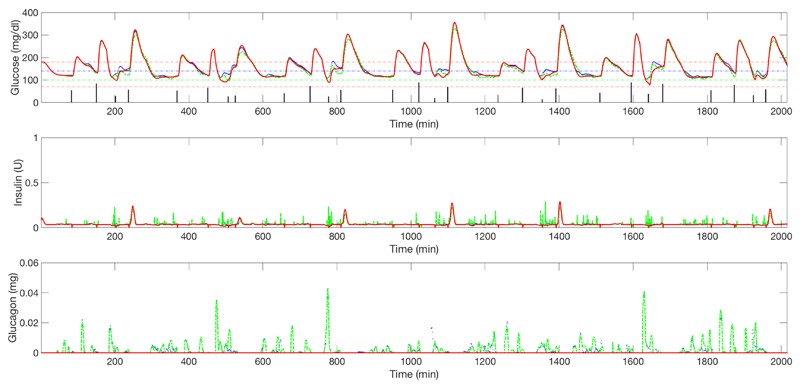
Figure 8.
Upper graph: average plasma glucose (children cohort) for closed-loop insulin-only therapy (red solid line) vs. un-coordinated bihormonal controller (blue solid line) vs. its coordinated counterpart (green dashed line) (one week). Vertical bars represent the meals. Middle graph: corresponding insulin delivery without considering the meal boluses. Lower graph: corresponding glucagon delivery.

