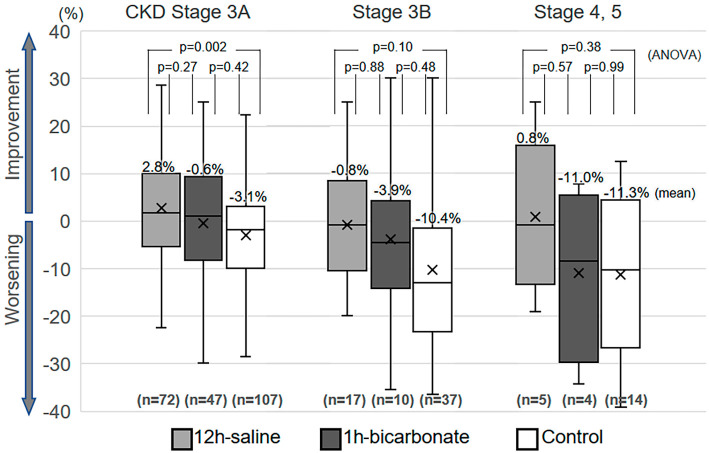
Figure 3.
Box plots of the percent-change divided by the CKD stage. The box plots depict the percent-change divided by the CKD stage. PCI: percutaneous coronary intervention, CKD: chronic kidney disease, defined as an estimated glomerular filtration rate of <60 mL/min/1.73 m2, ANOVA: analysis of variance

