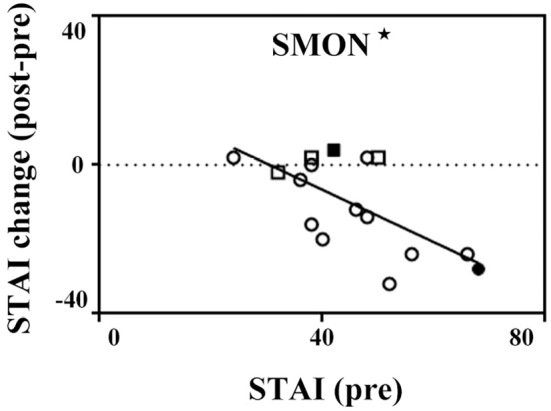
Figure 2.

Scatter plots describing the relationships between the baseline (pre) STAI and STAI score change (post-pre) in SMON patients. Black and blank squares show male SMON patients living alone (n=1) and with a single caregiver (n=3), respectively. Black and blank circles show female SMON patients living alone (n=1) and with a single caregiver (n=11). The baseline STAI scores were significantly correlated with the post-pre STAI scores. *p<0.05.
