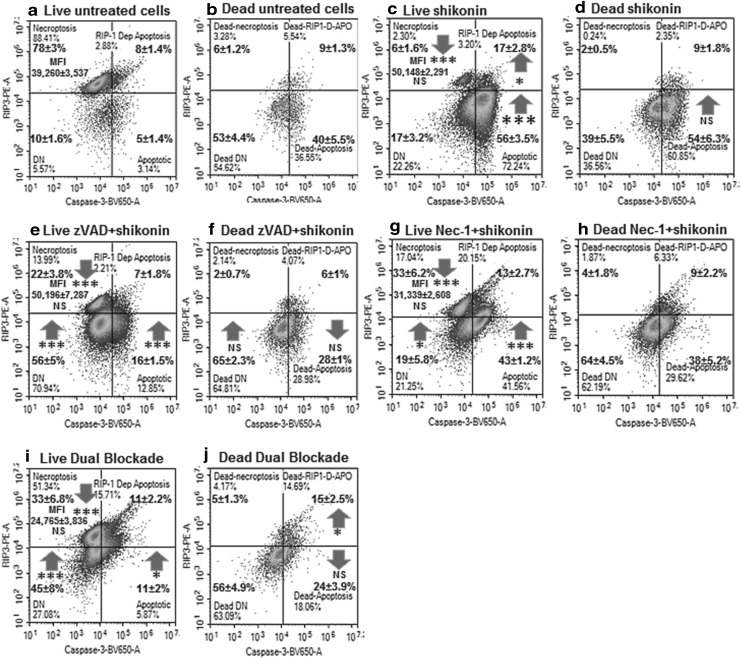
Fig. 3.
RIP3 and caspase-3 activation assay. After gating on live and dead cells from a Zombie NIR vs. Caspase-3-BV650 dot-plot untreated live (a) and dead (b) Jurkat cells were analysed on a RIP3-PE vs. Caspase-3-BV650 dot-plot with resting or necroptotic phenotype indicated by RIP3high + ve/Caspase-3− ve with the RIP3 Median Fluorescent Intensity (MFI) up-regulated during necroptosis. The apoptosis phenotype (RIP3− ve/Caspase-3+ ve), RIP1-dependent apoptosis (RIP3+ ve/Caspase-3+ ve) and double negative (RIP3− ve/Caspase-3− ve). Live and dead cells treated with 0.5 µM shikonin for 24 h (c, d) pre-treated with 20 µM zVAD for 2 h then with 0.5 µM shikonin for 24 h (e, f) pre-treated with 60 µM Nec-1 for 2 h then with 0.5 µM shikonin for 24 h (g, h) pre-treated with 20 µM zVAD and 60 µM Nec-1 for 2 h then with 0.5 µM shikonin for 24 h (i, j) n = 3, student t test NS (not significant), P < 0.05*, P < 0.01**, P < 0.001***, with arrows indicating change compared to untreated cells

