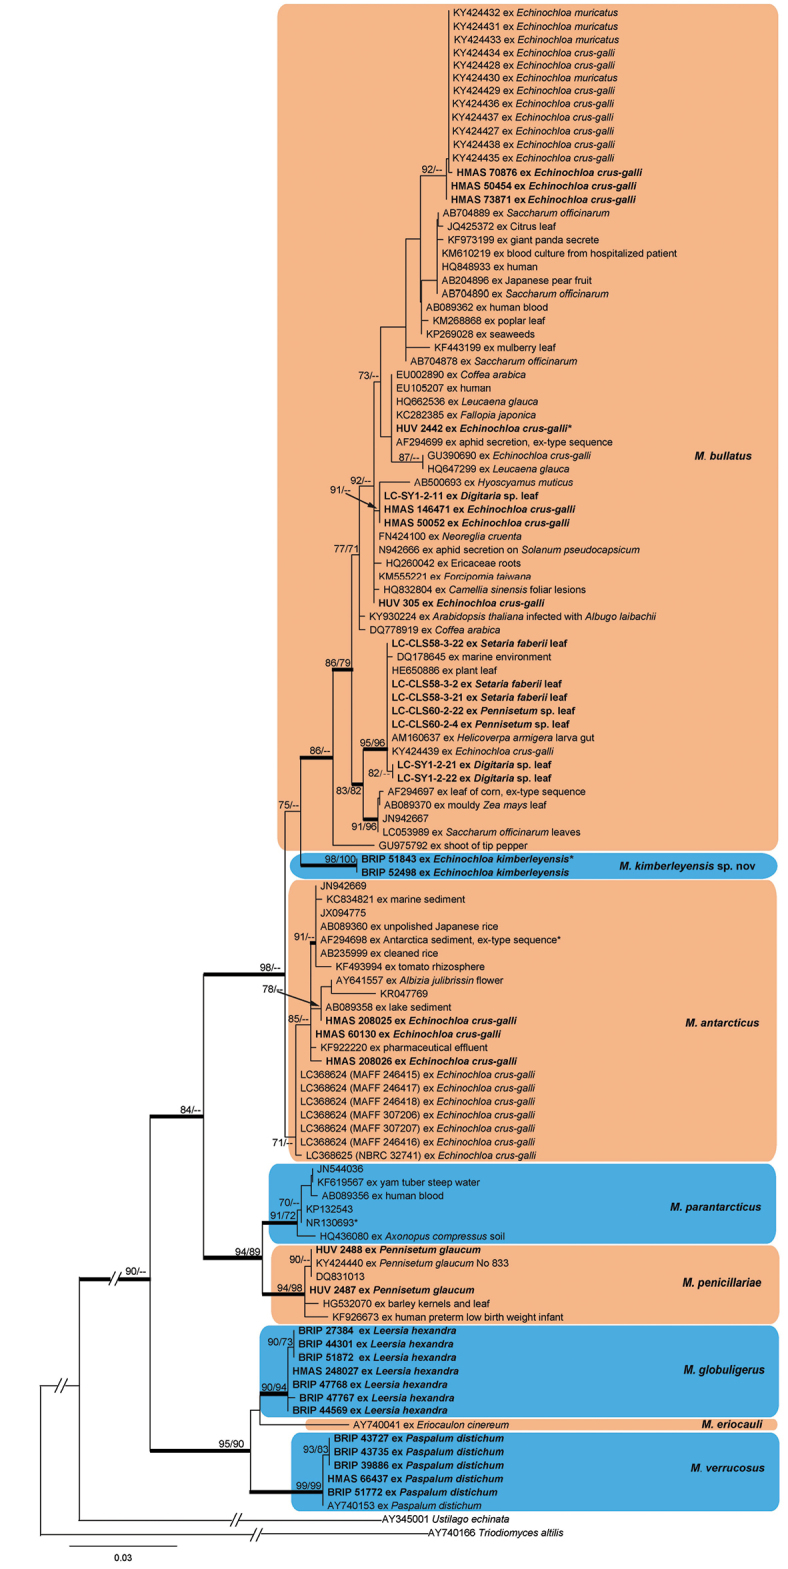
Figure 1.

Phylogram obtained from a ML analysis based on the ITS sequence alignment. Values above the branches represent ML bootstrap values (> 70%) from RaxML and PhyML analysis respectively. Thickened branches represent Bayesian posterior probabilities (> 0.95). The scale bar indicates 0.03 expected substitutions per site. * indicates type specimens or type strains.
