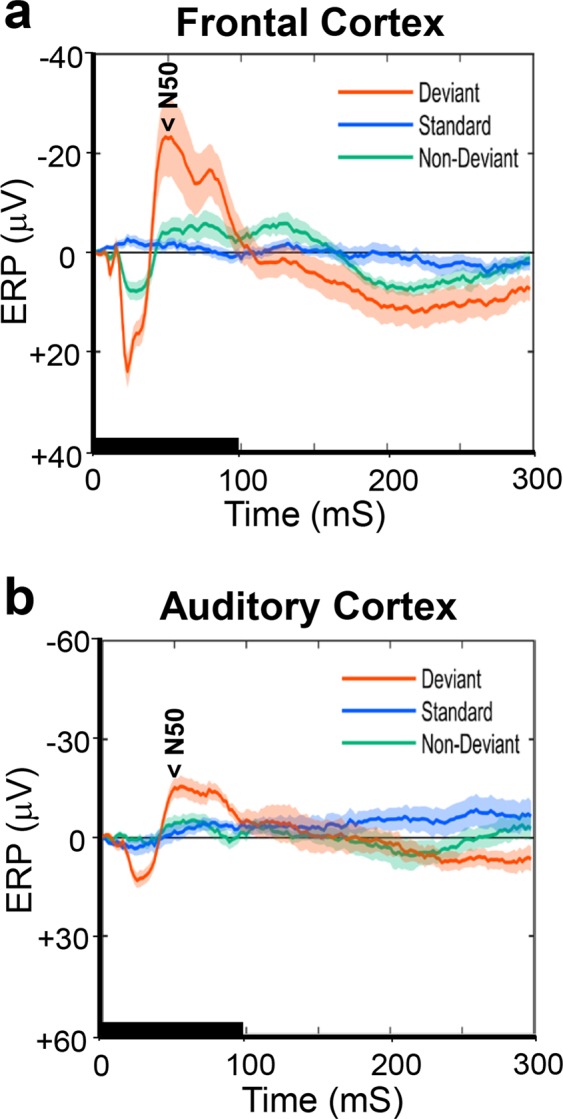
Figure 1.

Difference in the average event-related potentials (ERPs) between control and EGF-treated rats in the frontal cortex. ERP waveforms were recorded from an electrode on the frontal cortex in control (a)- and EGF (b)- treated rats and were grand averaged across subjects. Waveforms from the 6 kHz deviant (orange), the 3 kHz standard (sky blue), and the 6 kHz non-deviant (green) tones. The non-deviant tone has the same pitch and probability of occurrence as the deviant tone but does not stand out from the other stimuli (1, 1.5, 2, 3, 4, 5, 6, 7, 7.5 and 8 kHz). The shaded area around each ERP trace denotes the mean ± standard error (SE). The tone stimulation is marked with a thick horizontal line lasting for 100 ms. The major ERP component of N50 is marked. Data were obtained from 12 control and 12 EGF-treated rats.
