Figure 2.
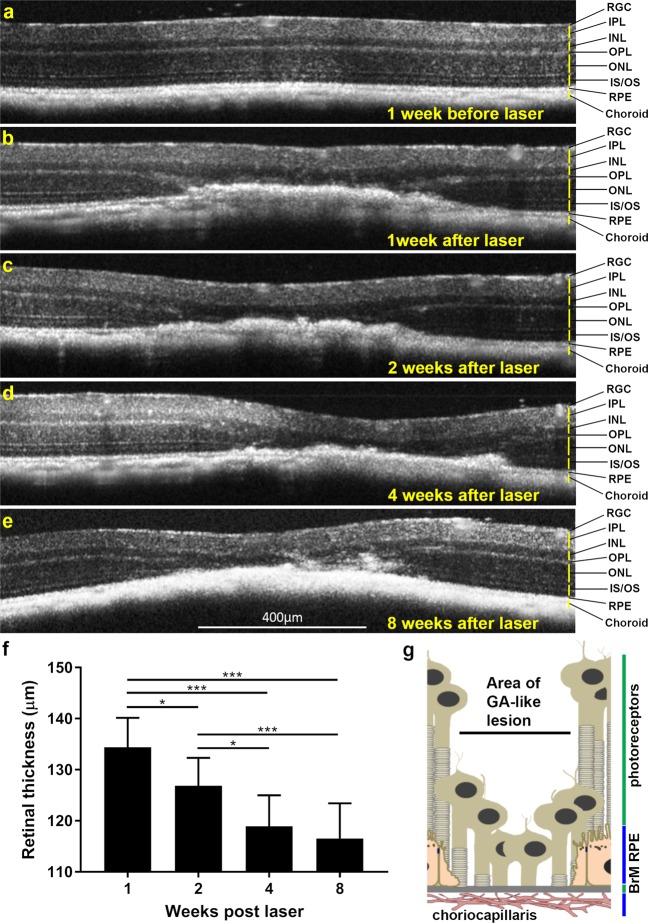
Longitudinal optical coherence tomography (OCT) of lasered mouse retinas show development of GA-like pathology. Representative OCT scan (a) 1 week before and (b) 1 week after laser treatment. Notice obliteration of the ONL and photoreceptor IS/OS. The clear demarcation of the RPE-BrM layer is also lost, although further details of pathology are difficult to distinguish. The OPL tapers into lesions and is no longer discernible as a distinct layer above the lasered spot. (c–e) Over the following weeks, lesions continue to persist, indicated by thickened areas of hyper-reflective pathology with progressive involvement of the INL and IPL, which appear to merge into lasered areas. Use of OCT scans thus provided insights into the involvement of distinct retinal layers over a 2 month period following laser treatment. Retinal ganglion cells (RGC), Inner plexiform layer (IPL), Inner nuclear layer (INL), Outer plexiform layer (OPL), Outer nuclear layer (ONL), IS/OS (inner and outer segments) of photoreceptors and Retinal pigment epithelium (RPE). OCT scans however do not allow the RPE and Bruch’s membrane (BrM) to be distinguished as separate layers. (f) OCT data was used to quantify the relative thickness of retinal lesions between weeks 1, 2, 4 and 8 following laser ablation. A statistically significant decrease in retinal thickness at lesion sites was observed between weeks 1, 2 and 4, after which the thickness of the retina became stable between weeks 4 and 8. Average of three measurements per lesion (n = 7, five month old mice). SEM with significance denoted by *p < 0.05 and ***p < 0.0001. [g] Speculative diagram based on OCT data showing arrangement of retina and associated tissues within lasered spots.

