Figure 4.
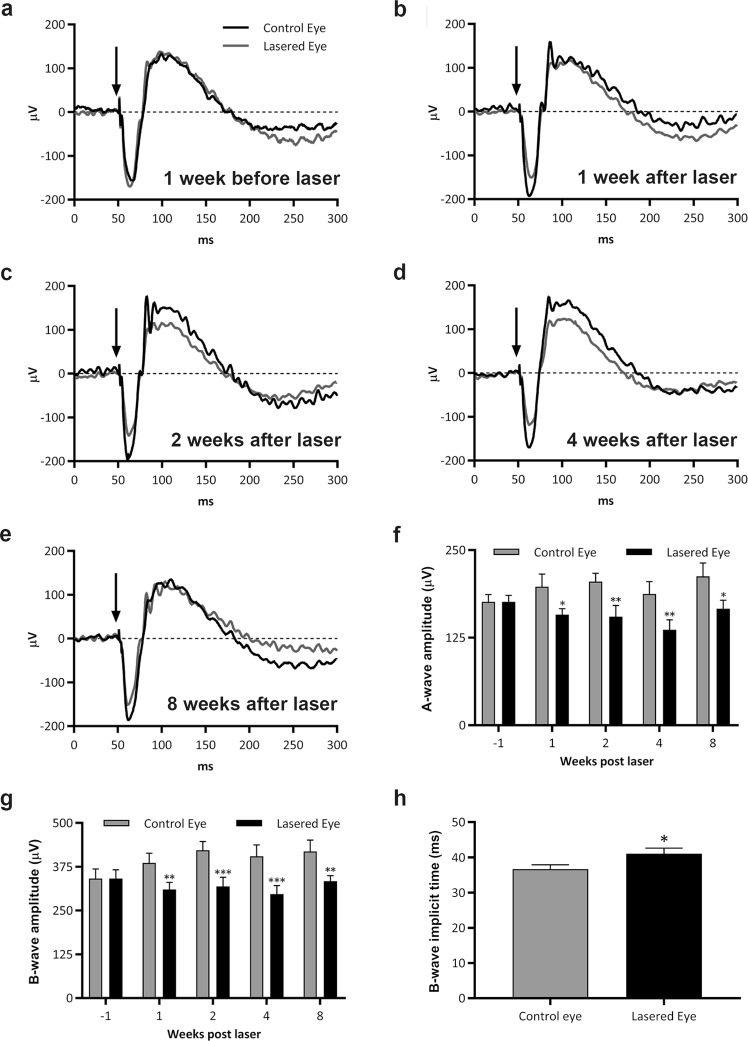
GA-like pathology corresponds to functional deficits in the mouse retina. Electroretinography (ERG) was used in longitudinal studies to measure the function of different retinal cell types. Average ERG traces are shown for lasered and non-lasered groups at (a) 1 week before laser, (b) 1 week after laser, (c) 2 weeks after laser, (d) 4 weeks after laser, and (e) at 8 weeks after laser. ERG values for lasered eyes were normalised to the fellow/control eye in each animal. (f) Comparison of A-wave amplitudes between lasered and non-lasered eyes. (g) Comparison of B-wave amplitudes, and (h) B-wave implicit times between lasered and non-lasered eyes. Arrows indicate point of the light stimulus. An average of 3 ERG measurements were obtained per eye at each time point (n = 8, five month old mice). Analysis by two-way ANOVA (repeated measures by both factors, factor 1: control vs. lasered eye, factor 2: time) followed with Holm-Sidak post-hoc testing. Graphs presented as mean ± SEM, significance denoted by *p < 0.05, **p < 0.01 and ***p < 0.0001.

