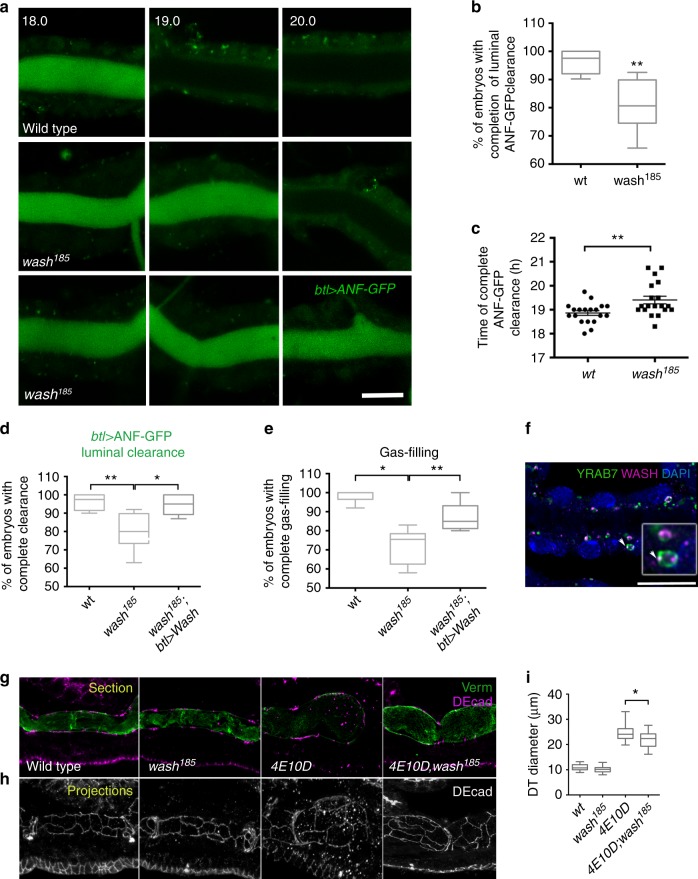
Fig. 4.
WASH (Wiskott–Aldrich syndrome protein and SCAR homologue) inactivation suppresses the Ptp4EPt10D tube shape phenotype. a Confocal frames showing the dorsal trunk (DT) of living wild-type and wash185 mutant embryos expressing btl>ANF-GFP (green). wash185 mutant embryos retain luminal ANF-GFP (lowest row) or delay clearance (middle row). Time points represent hours after egg laying (AEL). b Plots showing the percentage of wild-type (n = 48) and wash185 (n = 57) mutant embryos that complete ANF-GFP luminal clearance (20 h AEL). *P < 0.005 (unpaired two tailed t tests). c Plots depicting the average time (hours) of luminal ANF-GFP clearance completion in wild-type (n = 19) and wash185 (n = 19) mutant embryos. Error bars show s.e.m. **P < 0.001 (unpaired two tailed t test). d, e Plots depicting the percentage of wild-type (n = 27), wash185 (n = 32) and wash185;btl>Wash (n = 52) embryos completing the ANF-GFP luminal clearance (d) or gas filling (e). Re-expression of Wash specifically in the tracheal cells of wash185 mutants rescues the ANF-GFP luminal clearance and gas-filling defects. *P < 0.02; **P < 0.009 (unpaired two tailed t tests). f Confocal image depicting the DT of an embryo expressing endogenous YFP-tagged Rab7, stained with anti-WASH (magenta), anti-GFP (green) and DAPI (blue). Inset denotes zoomed view of a late endosome (arrowhead). Arrowheads indicate colocalization of WASH and Rab7. g, h Confocal images showing the tracheal DT of stage 17 wild-type, wash185, Ptp4EPtp10D and Ptp4EPtp10D;wash185 mutant embryos stained for Verm (green) and the AJ marker (DECad, magenta). Single sections (upper row) (g) and Z-stack maximum projections (lower row) (h). i Plots depicting the average DT diameter of wild-type (n = 12), wash185 (n = 14), Ptp4EPtp10D (n = 17) and Ptp4EPtp10D;wash185 embryos (n = 21). The DT diameter phenotype of Ptp4EPtp10D is significantly restored in the Ptp4EPtp10D;wash185 triple mutants. *P < 0.018 between Ptp4EPtp10D and Ptp4EPtp10D;wash185 embryos (unpaired two tailed t test). The boxplots show the median (internal line) and the range of the data is from 25th to 75th percentile. The bars present maxima and minima values. Scale bars, 10 μm

