Fig. 6.
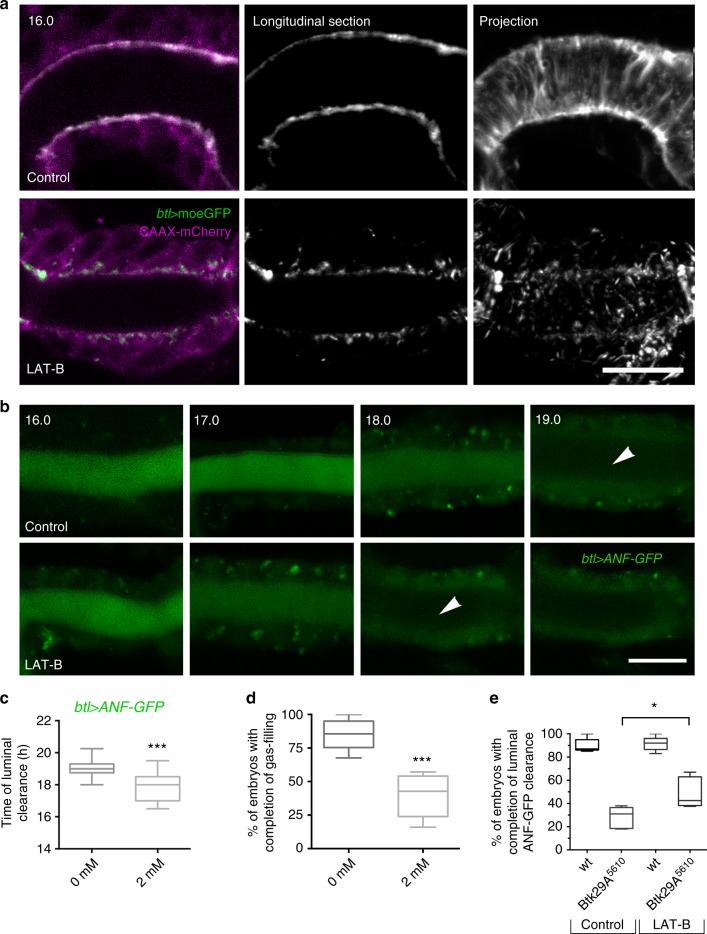
Chemical disruption of F-actin bundles induces apical endocytosis. a Airyscan confocal micrographs from live recordings showing the dorsal trunk (DT) of dimethyl sulfoxide (DMSO)-treated (control) or 2 mM (LAT-B)-treated wild-type embryos expressing the actin reporter btl>moeGFP (green and grey) and the membrane marker btl>CAAX-mCherry (magenta) in tracheal cells. Left and middle column show longitudinal sections. The right-most column depicts Z-stack projections. b Selected frames from confocal live imaging showing the DT of DMSO-treated (control) and 2 mM LAT-B-treated wild-type embryos expressing btl>ANF-GFP (green). LAT-B-treated embryos complete luminal btl>ANF-GFP clearance earlier than the controls (arrowheads). Arrowheads indicate the cleared tracheal lumen. Time points are hours after egg laying. c, d Plots showing the average time (hours) of luminal ANF-GFP clearance (c) or gas filling (d) in DMSO-treated (control) (n = 41) and LAT-B-treated (2 mM) wild-type embryos (n = 46). LAT-B-treated embryos clear luminal ANF-GFP significantly earlier. ***P < 0.001 denotes statistical significance (unpaired two tailed t tests). e Plots depicting the percentage of DMSO treated (control) wild-type (n = 50) and Btk29A5610 (n = 48) embryos as well as LAT-B-treated wild-type (n = 61) and Btk29A5610 embryos (n = 72) that complete luminal btl>ANF-GFP clearance. *P < 0.021 (unpaired two tailed t test). The boxplots show the median (internal line) and the range of the data is from 25th to 75th percentile. The bars present maxima and minima values. Scale bars, 10 μm

