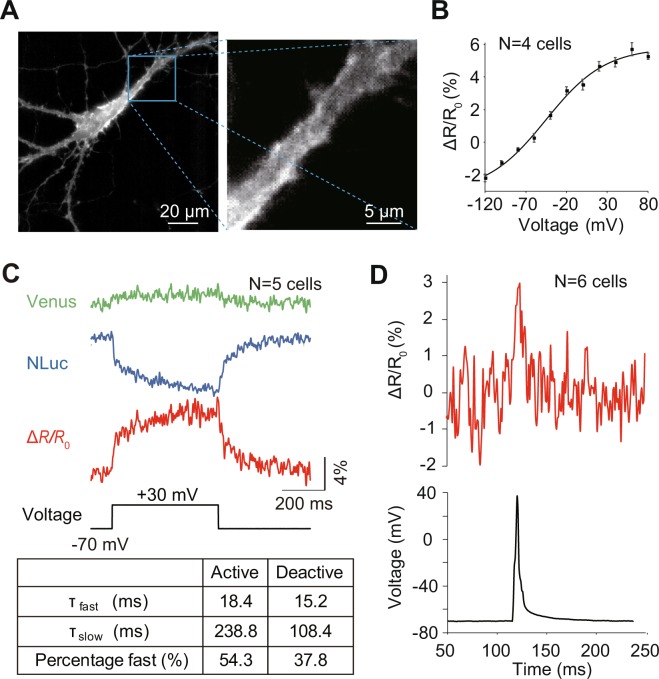
Figure 1.
Electrophysiological characterization of LOTUS-V in hippocampal neurons. (A; left) A representative bioluminescence image of a cultured hippocampal neuron expressing LOTUS-V. (A; right) An expanded image of the region within the square on the image on the left. (B) Plot of fractional ΔR/R0 versus voltage changes (n = 4 cells). The ΔR/R0 from −120 mV to + 80 mV was 5.3 ± 0.3%. The effective valence (Z) was 0.7, while the V1/2 was −45.5 mV. The plot was fitted using a Boltzmann function. (C) The Venus and NLuc signals (ΔL/L0), and their ratio (ΔR/R0), in response to voltage changes from the holding voltage (−70 mV to + 30 mV; n = 5 cells). (C; table) The fast and slow components, and their fraction of time constant. The activation and deactivation curves of ΔR/R0 were fitted using a two-component exponential equation. (D; upper) Action potential waveform of ΔR/R0 and (D; lower) electrophysiology (n = 6 cells). The imaging frame rate was 1 kHz. Error bars indicate mean ± standard error.

