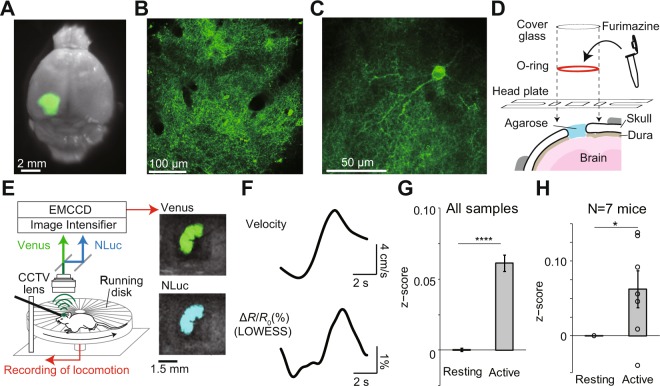
Figure 2.
Imaging of a head-fixed mouse with LOTUS-V. (A) Venus fluorescence in the primary visual cortex (V1) of a paraformaldehyde-fixed brain. (B,C) Examples of two-photon fluorescence images of V1 area containing LOTUS-V-expressing neurons (B) and a single V1 neuron spatially well resolved by two-photon microscopy (C). (D) Schematic drawing of the prepared cranial window. The headplate and o-ring were glued over the cranial window. The furimazine solution was enclosed in the o-ring bath by a cover glass. (E; left) Schematic drawing of the imaging setup for a head-fixed mouse. A mouse was placed on a running disk while the head was fixed to a bar via the headplate. The velocity was recorded through a rotary encoder during imaging. LOTUS-V bioluminescence from the V1 was collected through a CCTV lens. NLuc and Venus emissions were separated by image splitting optics. These emissions were acquired using an image intensifier unit, which can amplify the signal up to 106 times, and recorded with an EMCCD camera in the dark condition. (E; right) Overlaid images of bright-field and bioluminescence in NLuc and Venus channels acquired by this system. (F) Averaged time series of velocity and LOWESS-smoothed ΔR/R0 at the locomotion onset (n = 12 sessions from N = 3 mice). The Granger causality test was performed to determine whether the velocity Granger-causes ΔR/R0 statistically (p < 0.05). (G,H) Plots of z-normalized ΔR/R0 in resting (<5 cm/s) and active (>5 cm/s) states of head-fixed mice, using (G) all time-points (p < 0.0001, Wilcoxon rank sum test; n = 707871; 31653 time-points), or (H) average values from each mouse (p < 0.05, Wilcoxon signed-rank test; N = 7 mice). Error bars indicate mean ± standard error; *p < 0.05; ****p < 0.0001.

