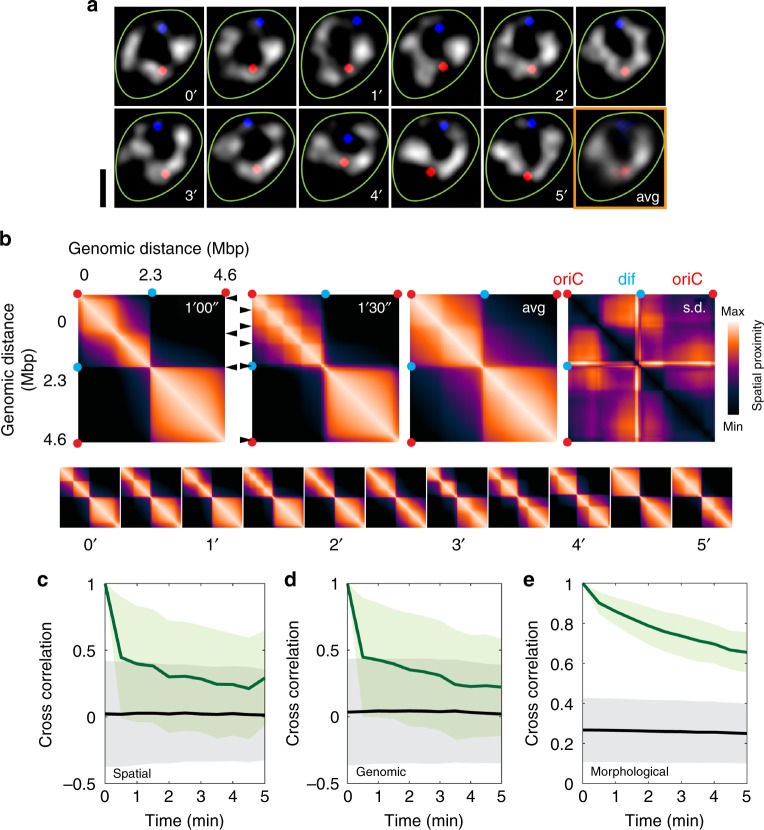
Fig. 4.
Temporal dynamics of the circular chromosome of E. coli. a Time-lapse structured-illumination microscopy (2D-SIM) images of a circular chromosome. Chromosomes in grey scale, Ori1/Ter3 localizations shown in red/blue, cell boundary in green. Time stamps are in minutes. The last frame is the time-average. Scale bar, 2 μm. b DNA spatial proximity maps derived from a single chromosome shown in a. Color bar indicates the level of spatial proximity for genomic loci along the circular chromosome. Arrowheads indicate apparent domain boundaries. Top panels, two consecutive frames, the time-average, and standard deviation values. Bottom panel, all 11 time frames. Red and cyan dots indicate Ori1/Ter3 loci. c–e Cross-correlation functions of individual chromosomes over time (green) compared to that across the cell population at each time point (black). These cross-correlation functions are measured with regard to the DNA density distribution along the contour in, respectively, spatial coordinates (c) genomic coordinates (d), and their morphology (e). Shown are mean and standard deviation values. n = 46

