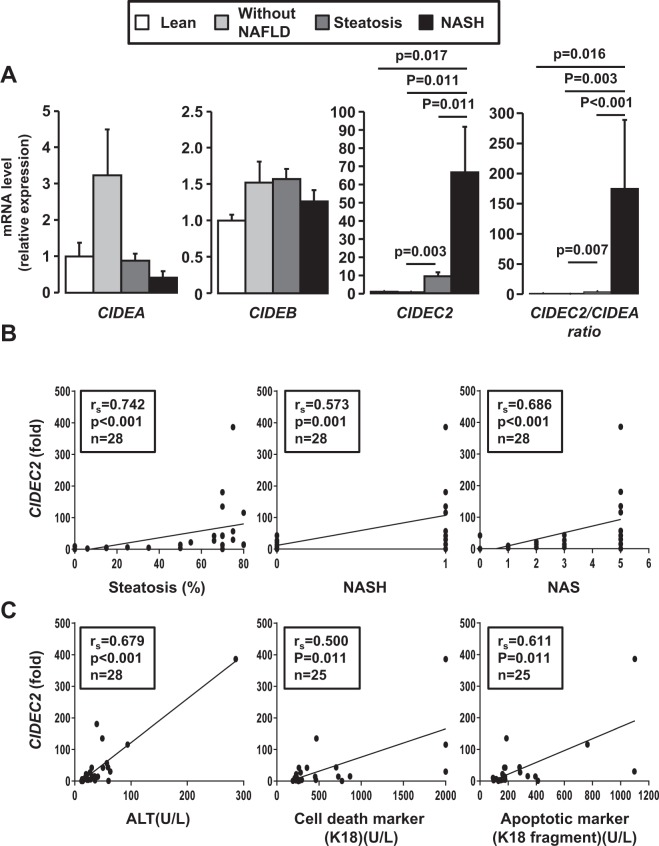
Figure 5.
Hepatic CIDEC2 expression progressively increased with steatosis and NASH in obese patients. (A) Liver CIDEA, CIDEB and CIDEC2 mRNA expression levels were analyzed by real-time quantitative PCR in lean patients (n = 5), in morbidly obese patients without NAFLD (n = 5), with hepatic steatosis (n = 14) and with NASH (n = 9). The gene expression values were normalized to RPLP0 mRNA levels. Results are expressed relative to the expression level in controls (means ± SEM) and statistically analyzed using the Mann–Whitney test. (B, C) Correlation between hepatic CIDEC2 expression (fold) with hepatic steatosis (%), ALT, NASH and NAFLD activity score (NAS), serum markers of hepatocyte apoptosis (caspases-generated keratin 18 fragment) and hepatocyte death (keratin 18) in 25–28 obese patients were analyzed using the Pearson’s correlation test.

