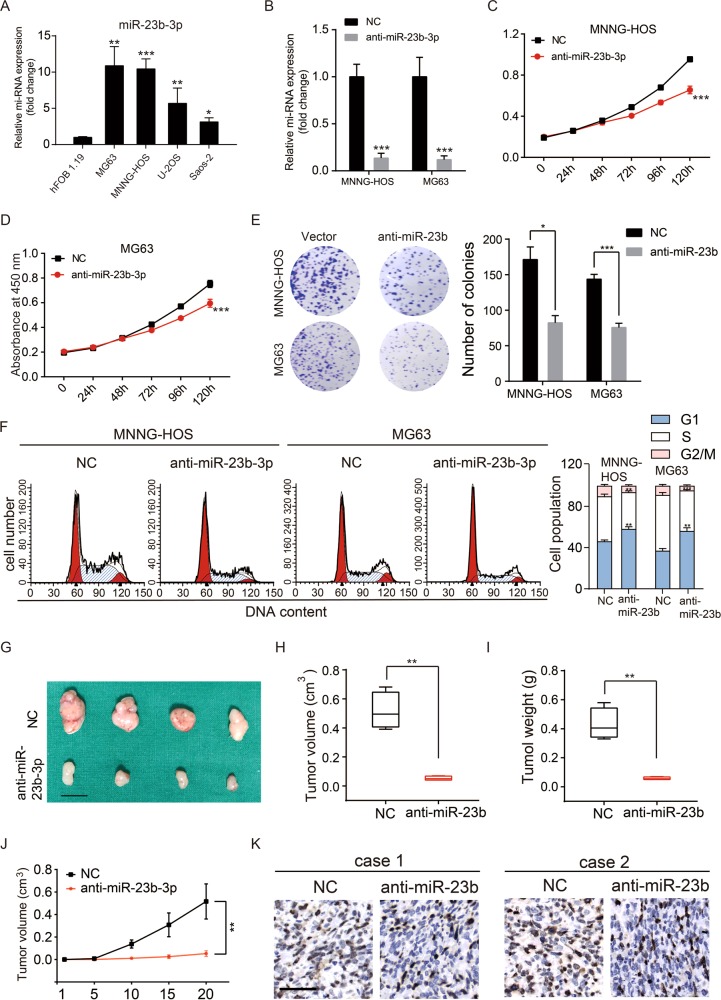
Fig. 1. miR-23b-3p promoted OS proliferation in vitro and in vivo.
a The expression patterns of miR-23b-3p in normal osteoblast cell line (hFOB1.19) and OS cell lines (MNNG-HOS, U-2OS, Saos-2, and MG63) by qRT-PCR. *p < 0.05, **p < 0.01, ***p < 0.001. b Knockdown efficacy of miR-23b-3p in wild OS cells (MNNG-HOS and *p < 0.05, **p < 0.01, ***p < 0.001. MG63) was determined by qRT-PCR, ***p < 0.001. c, d. Knockdown of miR-23b-3p inhibited MNNG-HOS and MG63 cell proliferation using the cell counting kit (CCK)-8 assay. Values are means ± SD, ***p < 0.001. e Downregulation of miR-23b-3p suppressed OS cell (MNNG-HOS and MG63 cells) proliferation using colony formation assay. Values are means ± SD, *p < 0.05, ***p < 0.001. f Knockdown of miR-23b-3p led to G1-phase cell cycle arrest and decreased S-phase cell population through using cell cycle analysis. Values are means ± SD, **p < 0.05, ***p < 0.001. g Morphologic characteristics of excised tumors from nude mice in MNNG-HOS/control group and MNNG-HOS/miR-23b-3p knockdown group (n = 4). Scale bars = 1 cm. h Tumor weight in miR-23b-3p overexpression group was reduced compared with control group (n = 4), **p < 0.01. i Tumor volume in miR-23b-3p overexpression group was reduced compared with control group (n = 4), **p < 0.01. j Tumor volumes were measured with calipers every 5 days. The growth rate in miR-23b-3p knockdown group was significantly slower than that in control group (n = 4), **p < 0.01. k Representative images of Ki67 staining in tissues from miR-23b-3p knockdown and control mice. Compared with control mice, decreased expression of Ki67 (upper panel) were observed. Scale bars = 50 μm

