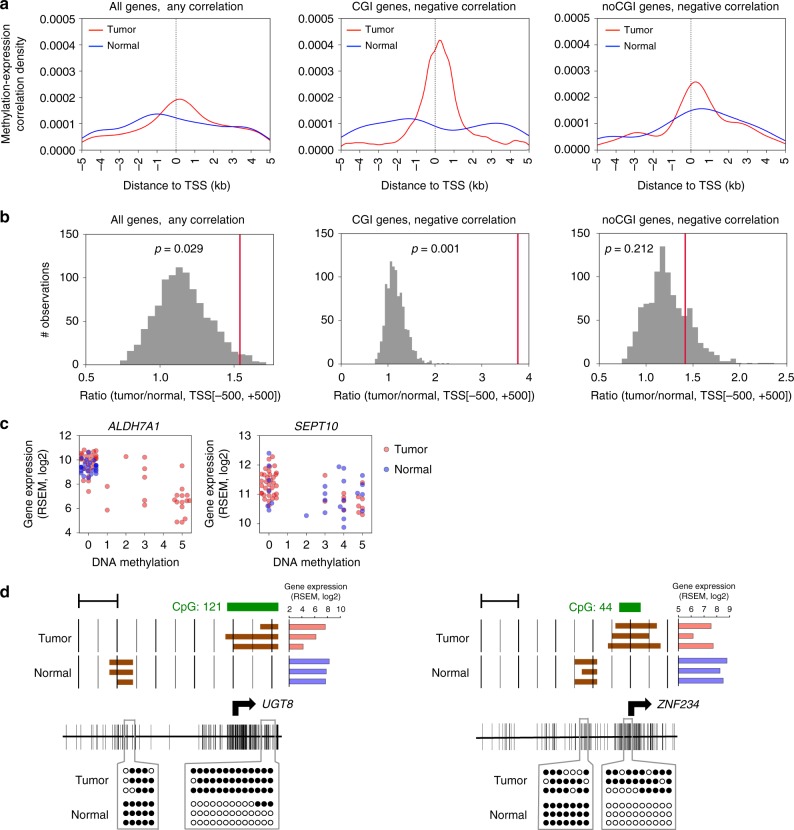
Fig. 2.
Association of DNA methylation at TSS with gene expression in HPVOPSCC. a Methylation-expression correlation density plots showing where DNA methylation and gene expression are significantly correlated (FDR q < 0.05), demonstrating a strong, tumor-specific association of expression with methylation at the TSS. Y-axis represents probability and the area under the curve (AUC) adds up to 1. Plots of any correlation in all genes (n = 19866) in our discovery HPVOPSCC data set, and negative correlation in genes with and without promoter-associated CpG island (CGI genes (n = 13158) and noCGI genes (n = 6708), respectively) are shown. b Significance of DNA methylation expression associations in tumor. The red line represents the observed AUC ratio (tumor/normal) at TSS ± 500 bp region. Histogram represents the null distribution as calculated by multiple permutations (n = 1000). Results of any correlation in all genes, and negative correlation in CGI genes and noCGI genes are shown. c Scatter plots of two representative genes for expression and DNA methylation levels at the most significantly correlated 500 bp window determined by MBD-seq. d Bisulfite sequencing confirmation of MBD-seq data from each two regions of two representative genes. The arrow indicates the TSS of each gene. Brown bars in the upper panel indicate binary methylation value at each 100 bp segment determined by MBD-seq. Red and blue bars show mRNA level determined by RNA-seq. Vertical lines in the lower panel represent CpG sites. Open and filled circles denote unmethylated and methylated CpG sites determined by bisulfite sequencing, respectively. Scale bars, 1 kb

