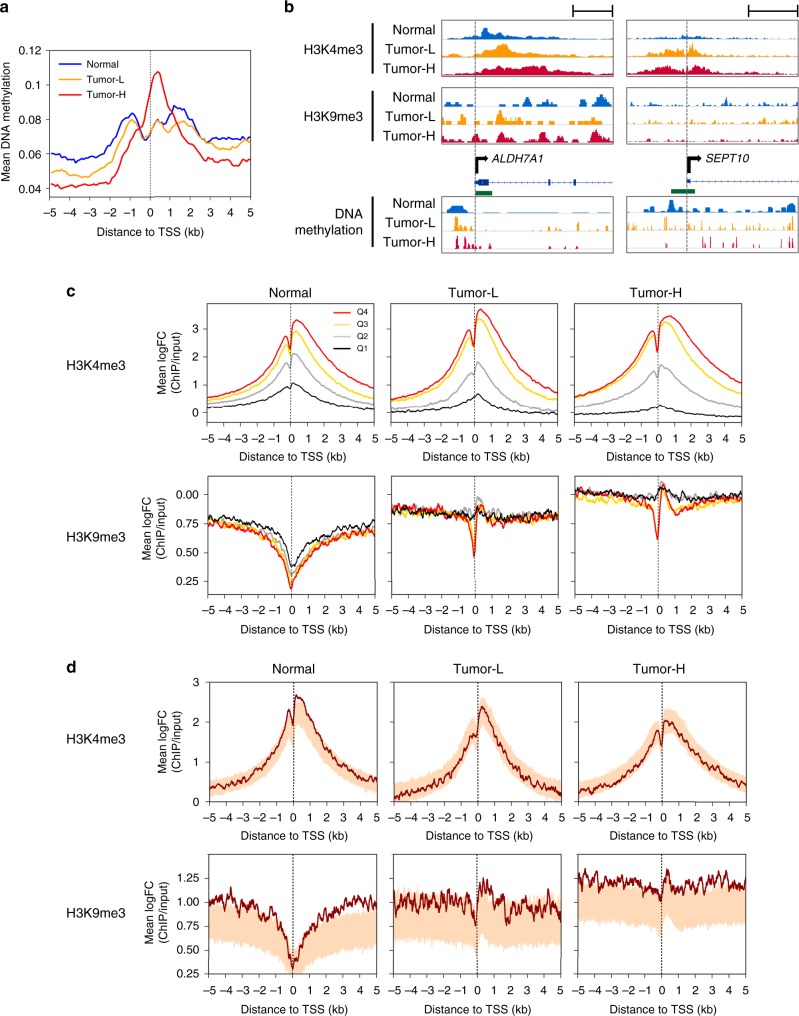
Fig. 4.
Chromatin structure correlation in normal oropharynx and PDXs. a DNA methylation profiles of the normal oropharyngeal tissue and highly/lowly methylated tumors. Mean DNA methylation value of RefSeq genes (n = 20013) determined by MBD-seq are shown. b ChIP-seq data for H3K4me3 and H3K9me3 histone marks and MBD-seq data of two representative genes (see also Fig. 2c). Genes (blue) and CpG islands (green) are presented in a forward fashion. Scale bars, 1 kb (left) and 5 kb (right). c Mean H3K4me3 and H3K9me3 levels of all genes in 10 bp windows separated by gene expression quartiles (Q4 is the highest expression). Plots for normal oropharyngeal tissue, lowly (Tumor-L), and highly (Tumor-H) methylated tumors are shown. The number of genes for Q1, Q2, Q3, Q4; n = 4366, 4373, 4358, 4382 for Normal, n = 4366, 4336, 4407, 4370 for Tumor-L, and n = 4370, 4369, 4370, 4370 for Tumor-H, respectively. d Mean H3K4me3 and H3K9me3 levels of 407 genes with significant correlation between DNA methylation and gene expression in our discovery cohort. The shaded region shows signal of 1000 randomized gene lists of the same size (n = 407) selected from the RefSeq genes, thus represents the genomic background for each window

