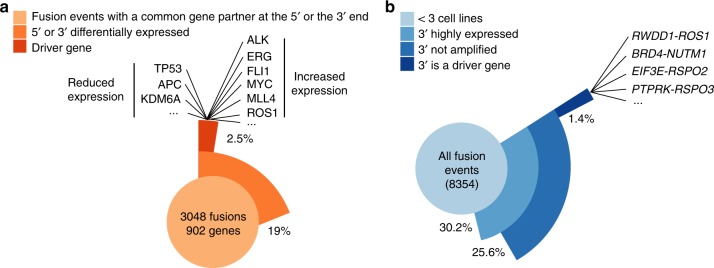
Fig. 2.
Fusions impact gene expression. a Frequency of a statistical association between a recurrent fusion (n > 2 cell lines) and differential gene expression. Examples of downregulated tumour suppressor genes (TSGs) and overexpressed oncogenes are displayed. b Frequency of co-occurrence of a gene fusion and overexpression of the 3′ gene for each fusion event. RSPO2, RSPO3, and NUTM1 are examples of overexpressed cancer driver genes involved in previously unreported gene fusions

