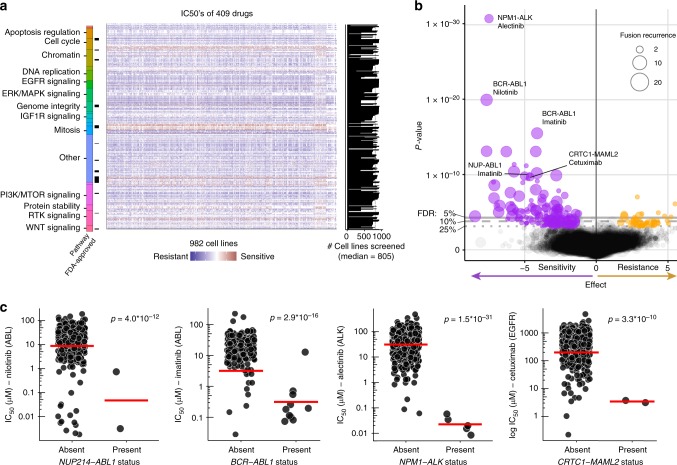
Fig. 3.
Gene fusions as therapeutic biomarkers. a Genomics of Drug Sensitivity in Cancer (GDSC) drug sensitivity data utilized (reported as half-maximal inhibitory concentration (IC50) values) with Food and Drug Administration (FDA)-approval status of compounds. Compounds are grouped by target or pathway. b Analysis of variance (ANOVA) results for fusion–drug associations. Each circle represents a tested association, with circle size indicating the number of cell lines harboring the associated fusion event (fusion recurrence), false discovery rate (FDR) thresholds are indicated. Negative effect sizes are associated with sensitivity and positive effect size resistance. Representative fusion–drug associations are labeled. c Examples of differential drug sensitivity in cell lines stratified by fusion status. Nominal therapeutic drug targets are in brackets. Each circle is the IC50 for an individual cell line and the red line is the geometric mean. Association significance values (p values) are from the ANOVA test

