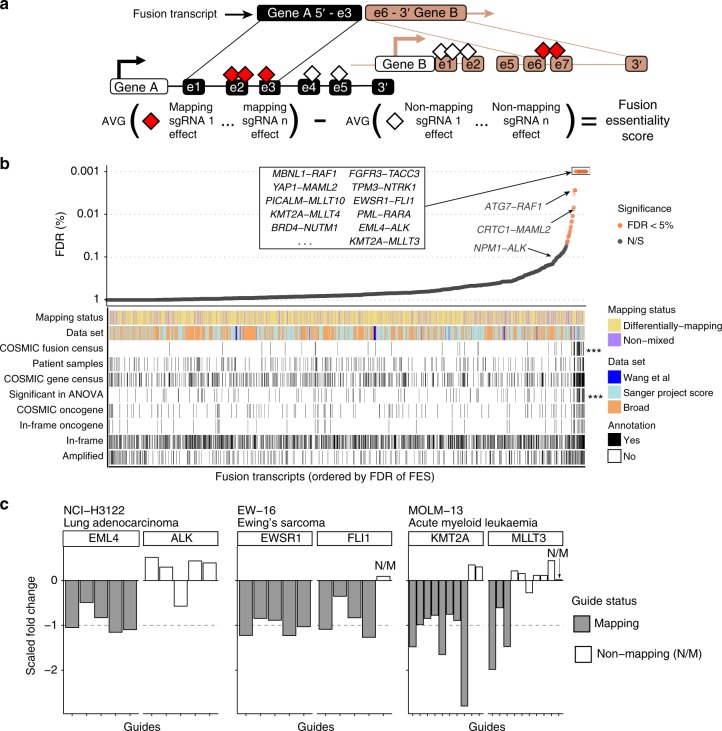
Fig. 4.
CRISPR screening data identifies functional fusions. a Calculation of fusion essentiality scores (FES) by measuring the differential fitness effect of mapping vs. non-mapping single guide RNAs (sgRNAs) to each gene in a fusion transcript. b False discovery rate (FDR) of FES scores for all testable fusion transcripts (n = 2821). Transcripts with at least one mapping and one non-mapping guide are “differentially mapping,” while transcripts with only mapping guides are “non-mixed”. Fusion transcripts were classified into the indicated genes sets and p values were calculated using gene-set enrichment analysis (GSEA). Selected known oncogenic fusions and other fusions of interest are labeled. c Examples of functional fusion transcripts identified in specific cancer cell lines based on FES scoring. Each bar is the scaled fold change of an individual sgRNA to fusion 5′ and 3′ end partner genes, and colored by fusion mapping or non-mapping sgRNA. Dashed line is at −1 (to which known essential guides were scaled). AVG = average; N/S = not significant at 5% FDR

