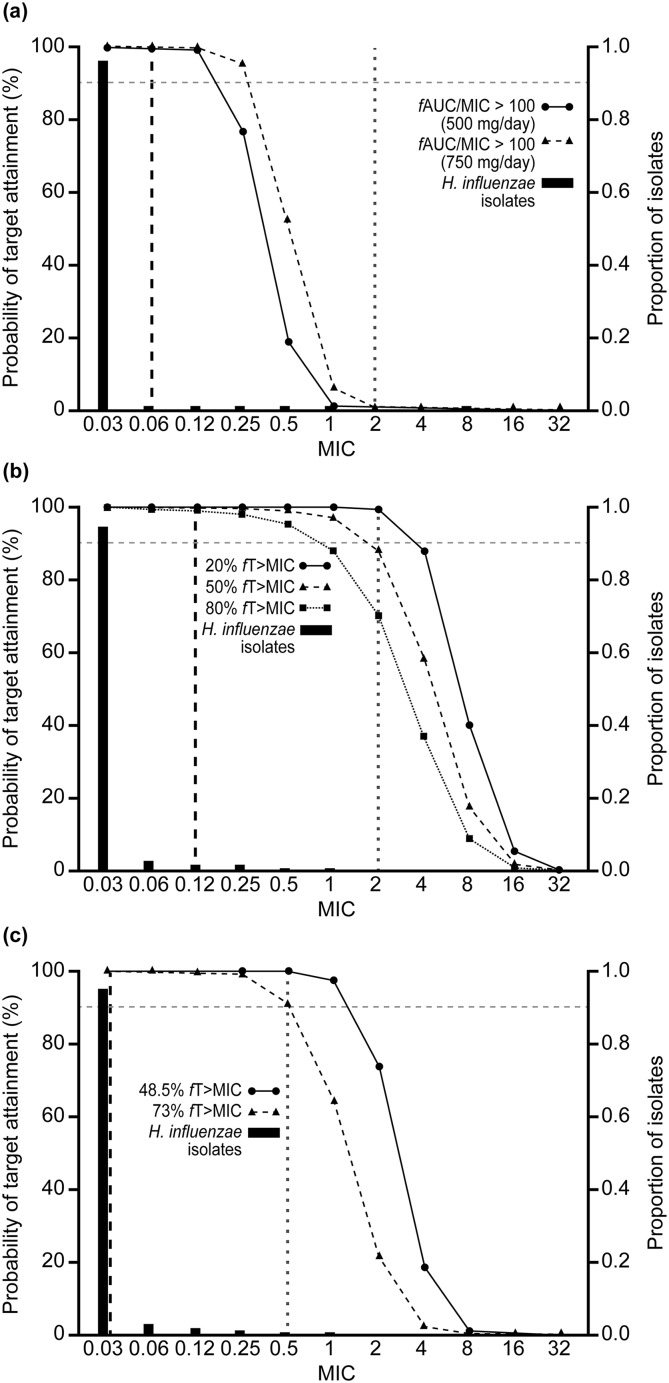
Fig. 3.
Probability of target attainment by MIC curves for Haemophilus influenzae, with proportion of isolates at each MIC according to AWARE global surveillance study data: a levofloxacin, b ceftriaxone and c ceftaroline. Black dashed vertical lines represent the EUCAST susceptible (S) breakpoints and grey dotted vertical lines represent the CLSI susceptibility breakpoints. AUC area under the curve, AWARE Assessing Worldwide Antimicrobial Resistance Evaluation, CLSI Clinical and Laboratory Standards Institute, EUCAST European Committee on Antimicrobial Susceptibility Testing, fAUC/MIC free area under the concentration–time curve:MIC ratio, fT > MIC percentage of time that free concentration is above the MIC, MIC minimum inhibitory concentration

