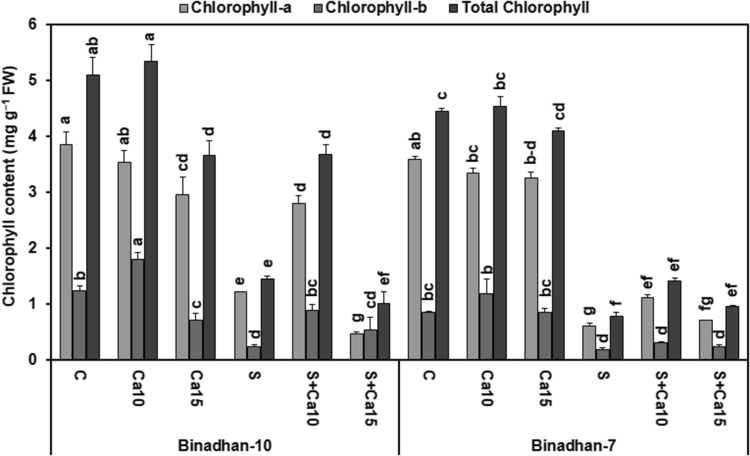
Fig. 1.
Effects of exogenous calcium on chlorophyll content of two contrasting rice cultivars grown under 100 mM NaCl stress for 15 days at seedling stage. The vertical bar indicates means of three replicates (n = 3) and the error bar indicates standard errors. Statistically significant differences among the treatments and cultivars are indicated by different alphabetical letters at P < 0.05 according to Fisher’s least significant difference test. FW, fresh weight; C, control (nutrient solution only); Ca10, Nutrient solution + 10 mM CaCl2; Ca15, Nutrient solution + 15 mM CaCl2; S, salt (100 mM NaCl); S + Ca10, 100 mM NaCl + 10 mM CaCl2 and S + Ca15, 100 mM NaCl + 15 mM CaCl2

