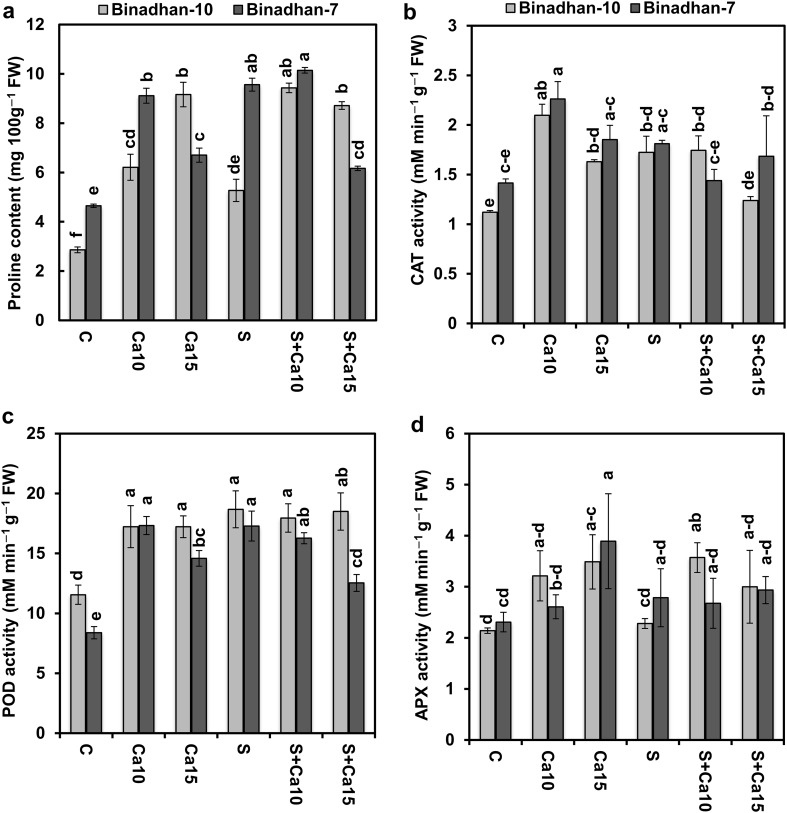
Fig. 2.
Effect of exogenous calcium on a proline content, b catalase (CAT) activity, c peroxidase (POD) activity and d ascorbate peroxidase (APX) activity of two contrasting rice cultivars grown under 100 mM NaCl stress for 15 days. The vertical bar indicates means of three replicates (n = 3) and the error bar indicates standard errors. Statistically significant differences among the treatments and cultivars are indicated by different alphabetical letters at P < 0.05 according to Fisher’s least significant difference test. FW, fresh weight; C, control (nutrient solution only); Ca10, Nutrient solution + 10 mM CaCl2; Ca15, Nutrient solution + 15 mM CaCl2; S, salt (100 mM NaCl); S + Ca10, 100 mM NaCl + 10 mM CaCl2 and S + Ca15, 100 mM NaCl + 15 mM CaCl2

