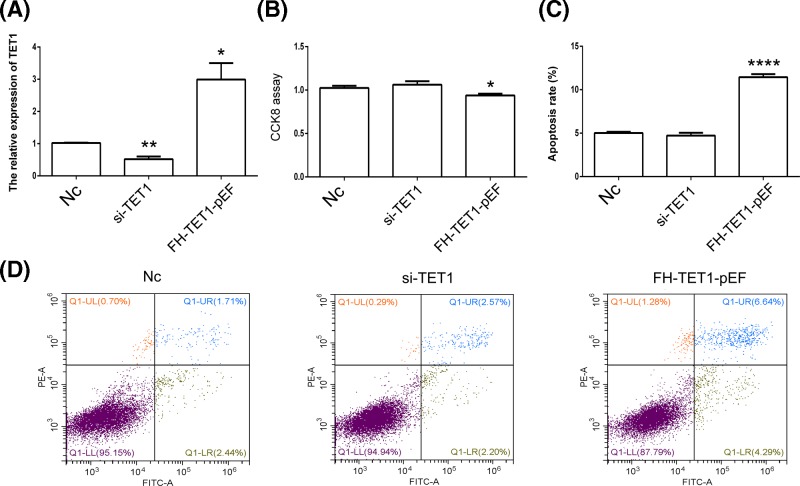
Figure 4. Analysis of cell growth and cell apoptosis.
TET1 expression in U2OS cells was analyzed using qPCR (A). Cell growth was analyzed using the CCK8 assay (B). Analysis of cell apoptosis after the hydroxyurea treatment (C andD). Nc indicates the negative control. *P<0.05, **P<0.01 and ****P<0.001 indicate statistically significant differences.

