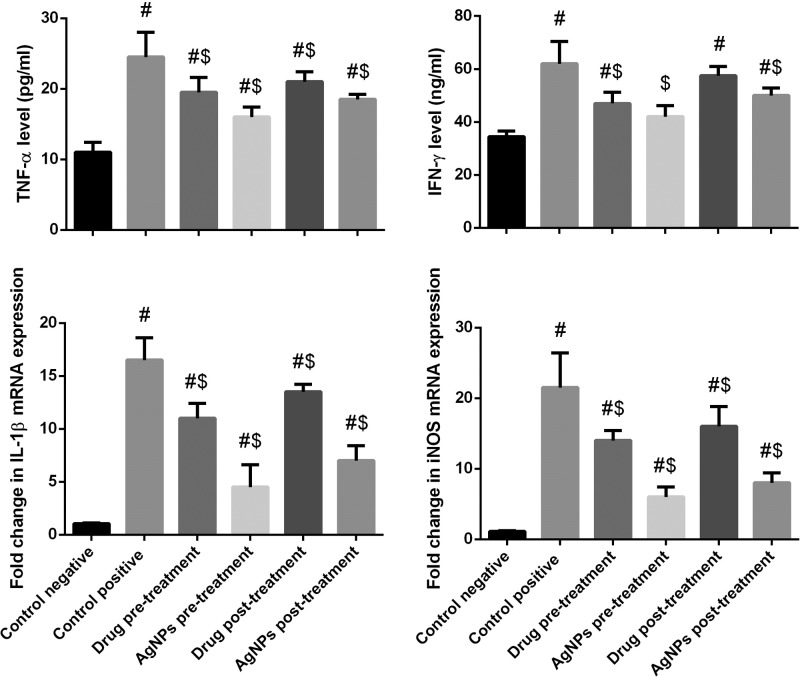
Figure 8. Histograms showing the effect of nanoparticles on proinflammatory cytokines of infected with T. gondii.
Values of biochemical results are the means ± SEM (n=7). Results for gene expression are presented as means ± SD of triplicate assays and normalized to β-actin and expressed as fold change (log2 scale), relative to mRNA levels in controls. #: significant change at P<0.05 with respect to the negative control group. $: significant change at P<0.05 with respect to the positive control group.

