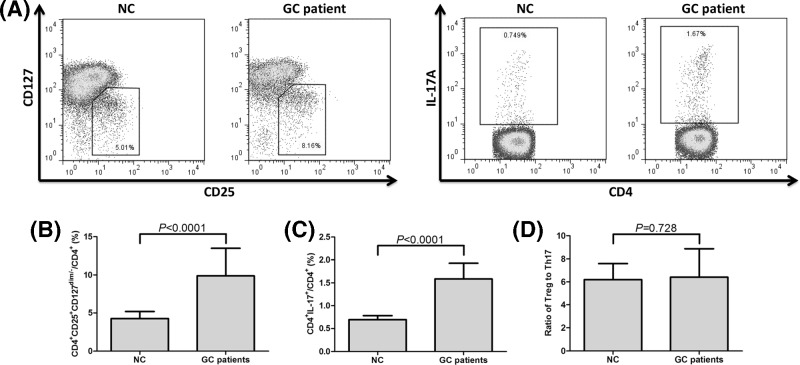
Figure 3. CD4+CD25+CD127dim/− Tregs and Th17 cells in NC (n = 18) or GC patients (n = 51).
(A) Representative dot plots of CD4+CD25+CD127dim/− Tregs and Th17 cells in NC and GC patients. The percentage of (B) CD4+CD25+CD127dim/− Tregs and (C) Th17 cells within CD4+ T cells was significantly elevated in GC patients in comparison with NC. (D) There was no remarkable difference in the ratio of Tregs to Th17 cells between NC and GC patients. Columns presented as means, and bars presented as standard deviations. Student’s t tests were used for comparisons.

