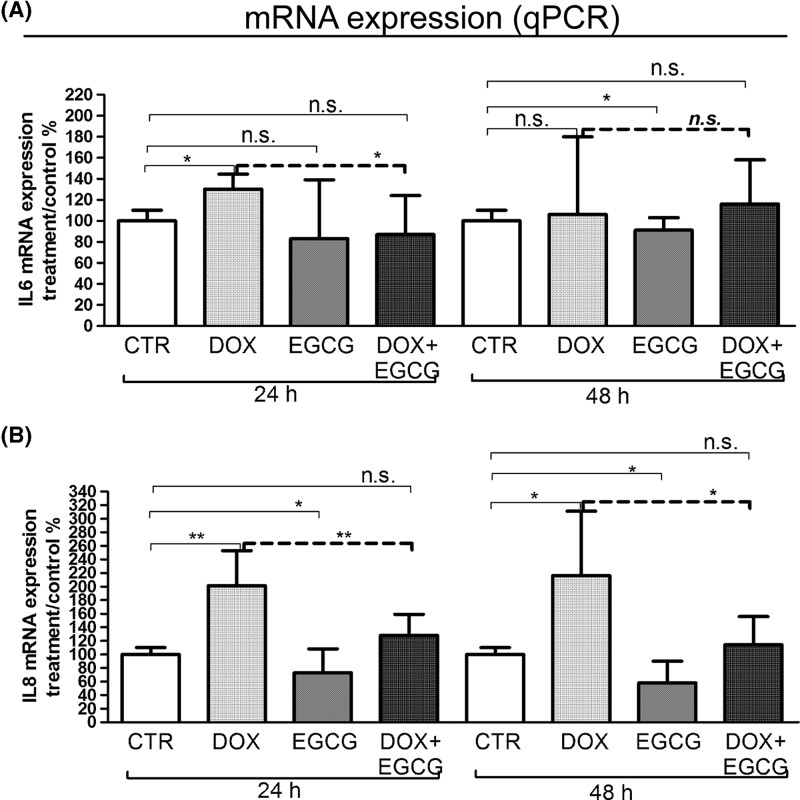
Figure 2. Effects of DOX and EGCG on interleukin mRNA expression in the ovarian tissue.
qRT-PCR for IL-6 and IL-8. RNA was isolated after 24 and 48 h treatment with DOX 1 μg/ml, EGCG 10 μg/ml, and combined treatment with DOX+EGCG at the aforementioned concentrations. IL-6 (A) and IL-8 (B) mRNA expression was shown as a percentage of treated on control samples (CTR). Each bar represents the mean (± S.D.) of three independent experiments. *P<0.05, **P<0.01, n.s.: not significant.

