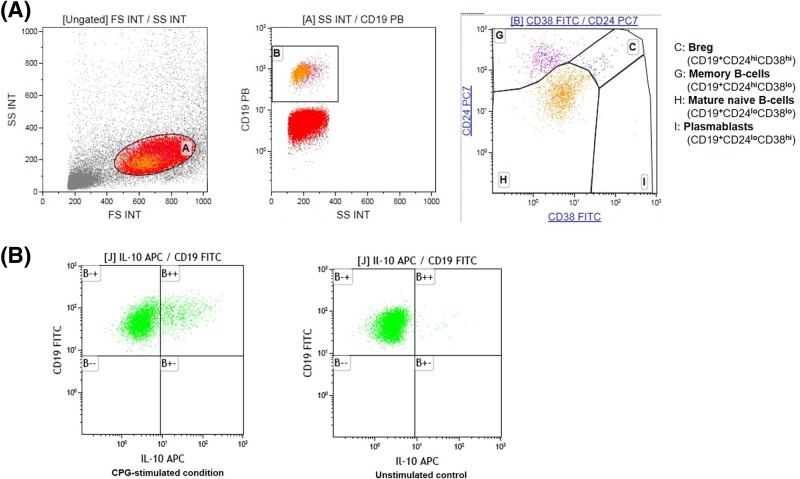
Figure 1. Representative flow cytometric data.
(A) Gating strategy to identify memory B cells, plasmablasts, mature naïve B cells and CD24hiCD38hi Breg. (B) Representative dot plots of IL-10+ Breg and the corresponding control; plots are gated on viable, activated, singlet CD19+ B cells. IL-10 production was assessed by flow cytometry after culture in presence or absence (control condition) of TLR9 agonists for 72 h and subsequent restimulation with PMA/ionomycin for 6 h.

