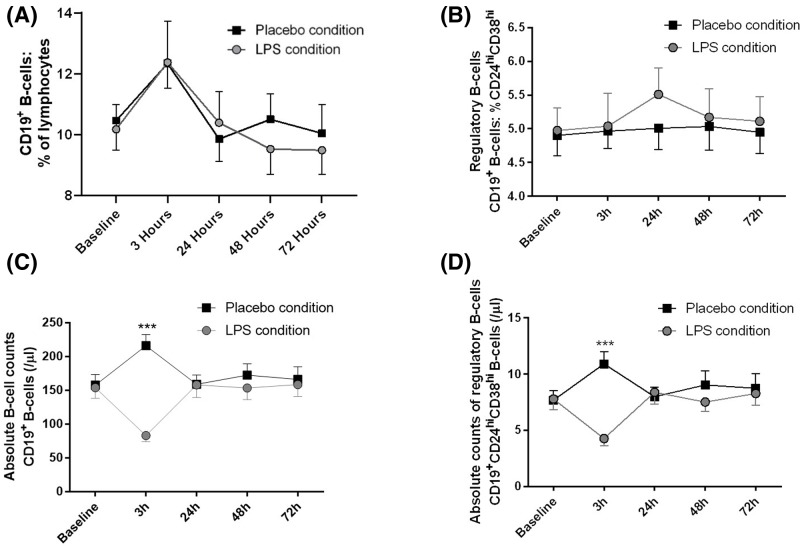
Figure 2. B-cell dynamics after LPS administration.
(A) Relative B-cell numbers, (B) relative Breg counts, (C) absolute B-cell counts and (D) absolute Breg counts were measured up to 72 h after the injection of 0.8 ng/kg body weight LPS- (gray) or placebo (black) (n=20). Data are shown as mean ± SEM. Two-way repeated measure ANOVA were performed followed by post-hoc Bonferroni-corrected paired t tests. ***P<0.001 represent P-values of post-hoc Bonferroni-corrected t tests. For results of ANOVA, see text.

