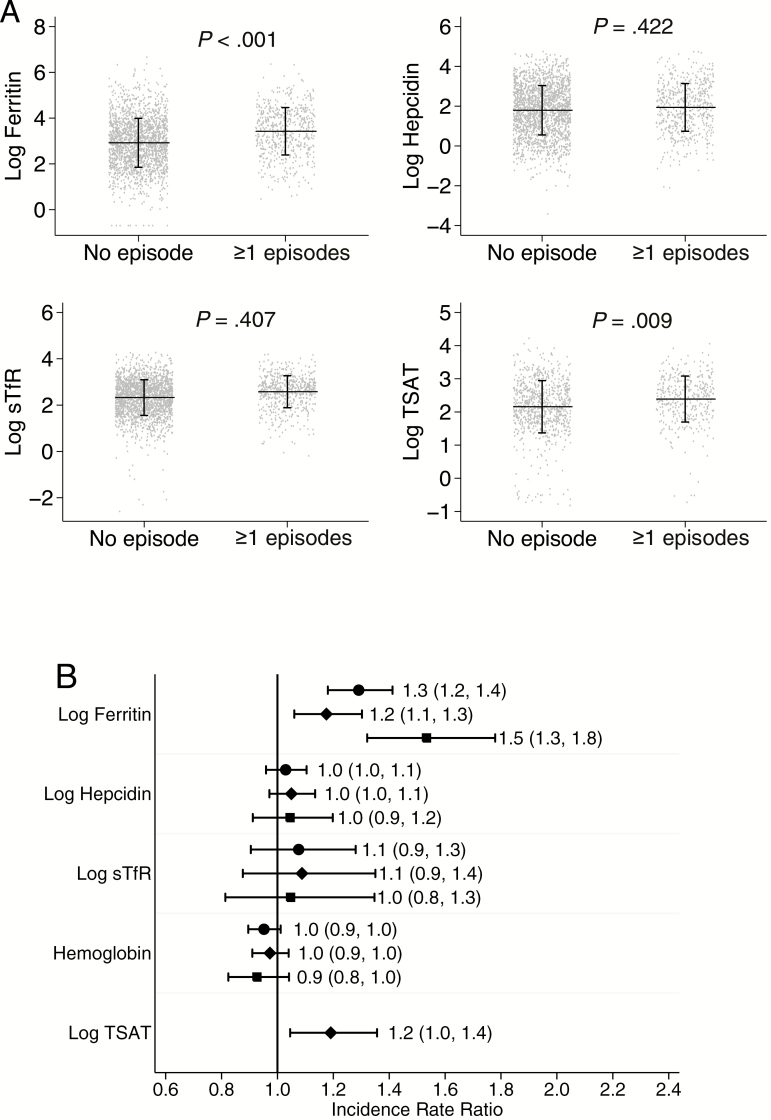
Figure 1.
The effect of iron status on subsequent malaria. A, Scatter plots of iron biomarkers stratified by no subsequent malaria or one or more subsequent malaria episodes. Horizontal line indicates mean while vertical line indicates standard deviation. P value was derived from Poisson regression model. B, Adjusted incidence rate ratios for the effect of iron biomarkers on subsequent malaria episodes. Circle marker indicates overall, diamond Kenya and square Uganda. Labels indicate incidence rate ratio and 95% confidence intervals. Poisson regression models were adjusted for age, sex, parasitemia, inflammation, length of follow-up and study site. Maximum length of follow-up was 6 months. Abbreviations: sTfR, soluble transferrin receptor; TSAT, transferrin saturation.

