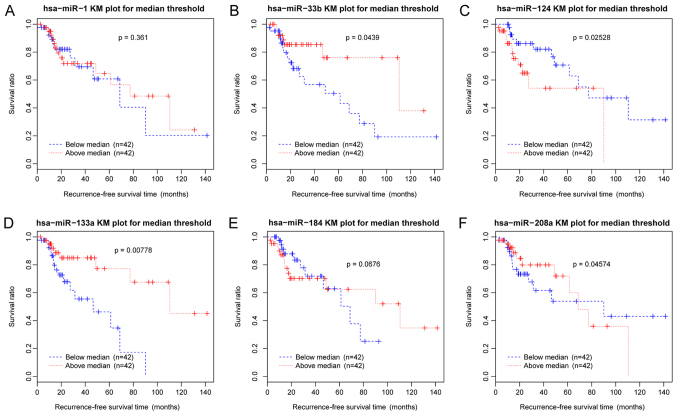
Figure 11.
KM survival curves of the differentially expressed miRs in the competing endogenous RNA regulatory network constructed using 32 optimal feature coding genes. Blue curves represent samples with downregulated miRs and red curves represent samples with upregulated miRs. (A) hsa-miR-1. (B) hsa-miR-33b. (C) hsa-miR-124. (D) hsa-miR-133a. (E) hsa-miR-184. (F) hsa-miR-208a. KM, Kaplan-Meier; miR, microRNA.

