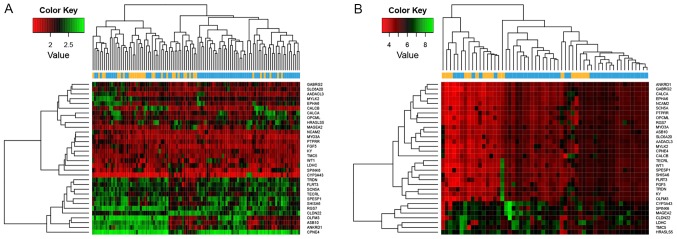
Figure 6.
Classification effect of the support vector machine classifier. Classification effect was investigated on the two validation datasets, (A) GSE27020 and (B) GSE25727. Yellow represents recurrent samples and blue represents nonrecurrent samples. Red indicates upregulated genes and green indicates downregulated genes.

