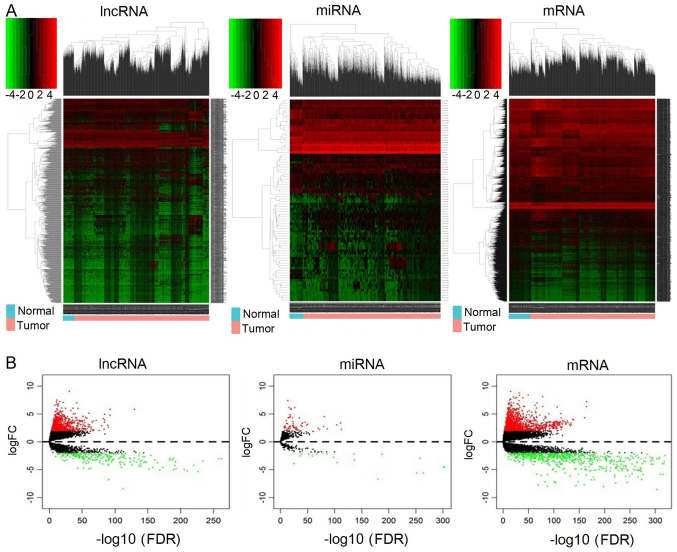
Figure 1.
Heatmap and volcano plots demonstrating differential lncRNA, mRNA and miRNA expression between normal and cancer samples. (A) Heatmap of DElncRNAs, DEmiRNAs and DEmRNAs. Sample clusters are included above the heatmap. Clusters of DElncRNAs, DEmiRNAs and DEmRNAs are noted on the left of the heatmap. Red represents upregulated genes and green represents downregulated genes. Normal samples (blue) are on the left side of each heatmap, and tumor samples (pink) are on the right. (B) Volcano plots reflecting number, significance and reliability of differentially expressed lncRNAs, miRNAs and mRNAs. Red dots indicate upregulation and green dots indicate downregulation of lncRNAs, miRNAs and mRNAs. Black dots show the lncRNAs, miRNAs and mRNAs with expression of |log2FC|<2. The x-axis represents an adjusted FDR and the y-axis represents the value of log2 FC. Aberrantly expressed lncRNAs were calculated by DESeq R. In total, 777 upregulated and 251 downregulated lncRNAs, 68 upregulated and 21 downregulated miRNAs, and 1,434 upregulated and 721 downregulated mRNAs were identified. lncRNA, long non-coding RNA: miRNA, microRNA, DE, differentially expressed; FC, fold change; FDR, false discovery rate.

