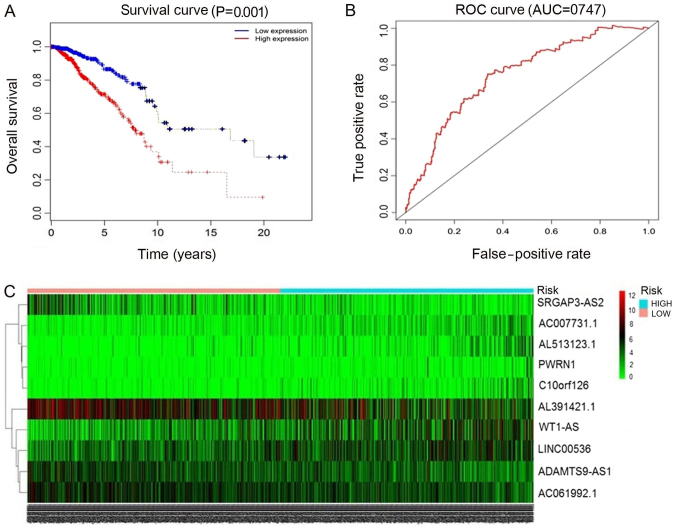
Figure 3.
ROC curves and heatmap of the top 10 lncRNAs sorted by AUC in breast cancer. (A) The red line represents cases with high expression, and blue line represents cases with low expression. The x-axis indicates overall survival time (days), and the y-axis indicates the survival rate. Kaplan-Meier analysis was performed, and the curves were generated by R. (B) The red line represents the sensitivity curve, and the black line represents the identifying line. The x-axis indicates the false-positive rate. The y-axis indicates the true-positive rate. (C) Heatmap of the top 10 lncRNAs. Expression intensity increases from green to red, where green represents low expression, and red represents high expression. ROC, receiver operating characteristic; lncRNAs, long non-coding RNAs; AUC, area under the curve.

